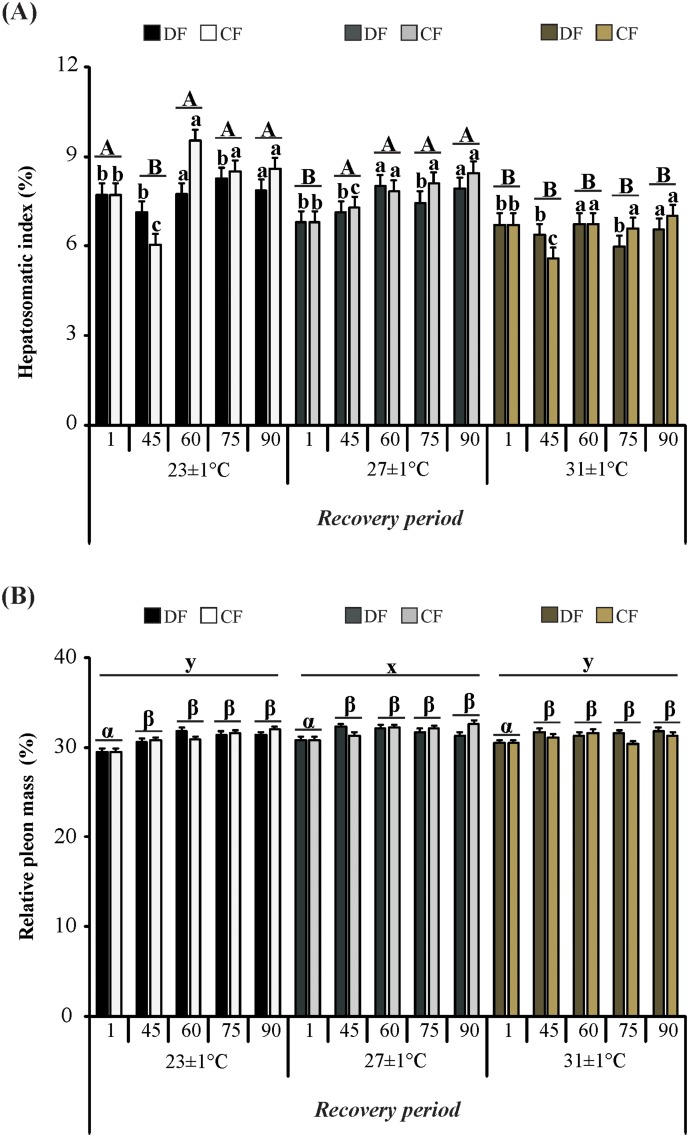
Fig 4. Organ-somatic indexes of the redclaw crayfish C. quadricarinatus throughout the experiment.
(A) Hepatosomatic index and (B) Relative pleon mass. Temperature regimes: 23±1°C, 27±1°C and 31±1°C; feeding regimes: DF (juveniles fed daily throughout the experimental period) and CF (juveniles fed for 4 days followed by 4 days of food deprivation intermittently during the first 45 days of the experimental period and fed daily from day 45 to day 90), and days of the experiment: day 1 (beginning of the experiment), day 45 (the end of restriction period), day 60, 75 and 90 (recovery period). Letters “a,b,c” indicate significant differences interaction between feeding regime and time. Letters “A,B” indicate significant differences interaction between temperature and time. Letters “x,y,z” indicate significant differences among temperatures. Letters “α,β” indicate significant differences among time.

