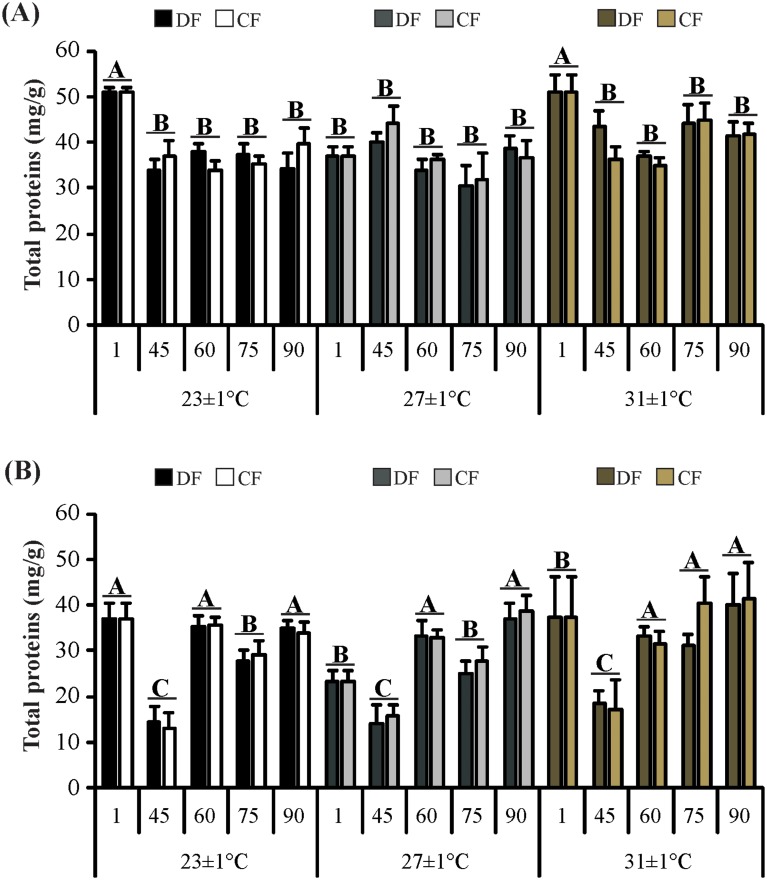
Fig 5. Total proteins in the tissues of the redclaw crayfish C. quadricarinatus throughout the experiment.
(A) Hepatosomatic index and (B) Relative pleon mass. Temperature regimes: 23±1°C, 27±1°C and 31±1°C; feeding regimes: DF (juveniles fed daily throughout the experimental period) and CF (juveniles fed for 4 days followed by 4 days of food deprivation intermittently during the first 45 days of the experimental period and fed daily from day 45 to day 90), and days of the experiment: day 1 (beginning of the experiment), day 45 (the end of restriction period), day 60, 75 and 90 (recovery period). Letters “A,B,C” indicate significant differences interaction between temperature and time.

