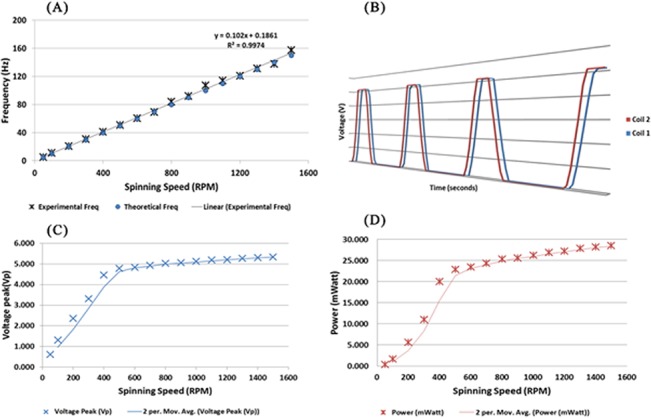
Fig 7.

(A) Frequency of the voltage generated in comparison with the calculated frequency from the spinning speed of the disc. The black line represents the linear fit of theoretical and experimental data with a linear regression value of R2 = 0.9974 (n = 16). (B) Generated voltage from two coils adjacent to each other with a 60° angle in between. 3D perspective chosen to represent the graph is to show the very minute phase difference between both coils’ outputs, approximately 1.016 ms. (C) The peak voltage generated from a single coil relative to the spinning speed (RPM). Output peak voltage illustrated by the moving average trend line of 2 periods. (D) Power generated relative to the spinning speed and the trendline illustrated with the moving average of 2 periods.
