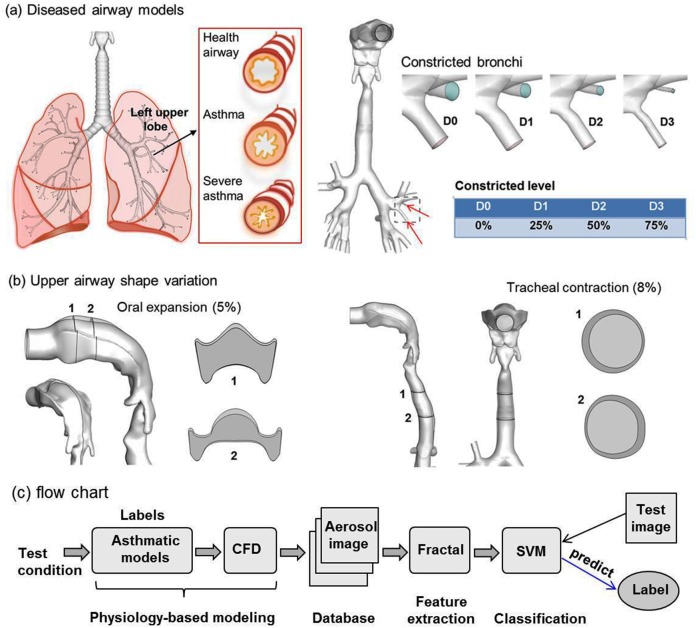
Fig 1. Asthmatic models (a), upper airway variation (b), and flow chart (c) of the proposed method methodology.
The airway constriction level in the asthmatic models ranges from 0% (D0) to 75% (D3). The shape variations represent the potential uncertainties in the upper airway during breath tests. There is 5% oral expansion and 8% tracheal contraction relative to the control cases. Physiology-based modeling was undertaken to generate exhaled aerosol images; the images were characterized using fractal analysis to extract salient features; a SVM classifier was trained with extracted feature vectors and tested with extra samples. CFD: computational fluid dynamics; SVM: support vector machines.

