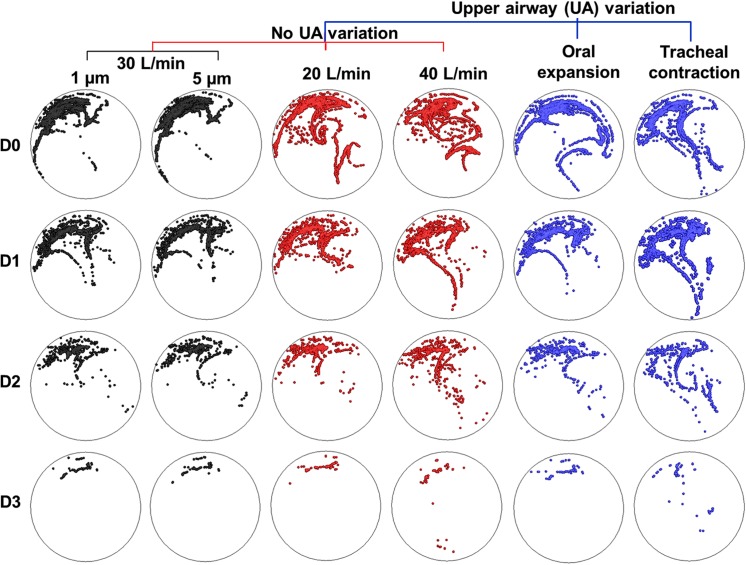
Fig 4. Comparison of exhaled distributions of the particles released from the diseased sites among conditions with different particle sizes, inhalation flow rates, and upper airway geometries.
Each column represents a comparison among the four asthmatic models for a given test condition. Each color comprises two columns and represents a comparison by varying one test parameter. Both similarities and differences were observed among the cases.

