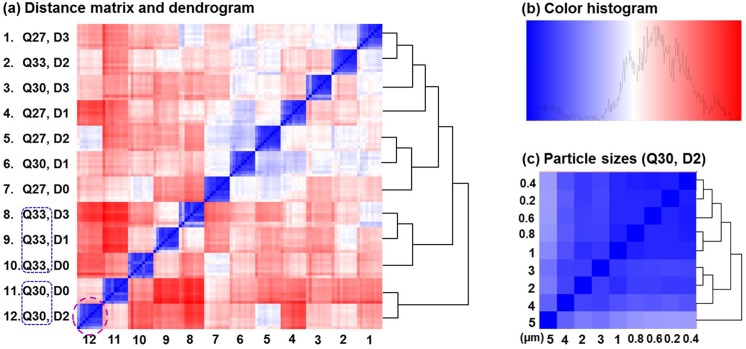
Fig 7. Distance matrix and dendrogram for the 108-sample-experiment which has a respiration range of 30±3 L/min with no upper airway variation.
Detailed dendrograms showing hierarchical clustering of particle sizes have been cut off for visual clarity in (a). The color histogram is shown in (b) and an example of the particle dendrogram at the location ([12, 12]: Q30, D2) is shown in (c). The prediction accuracy is 100% in this idealized condition. Q30: inhalation flow rate = 30L/min.

