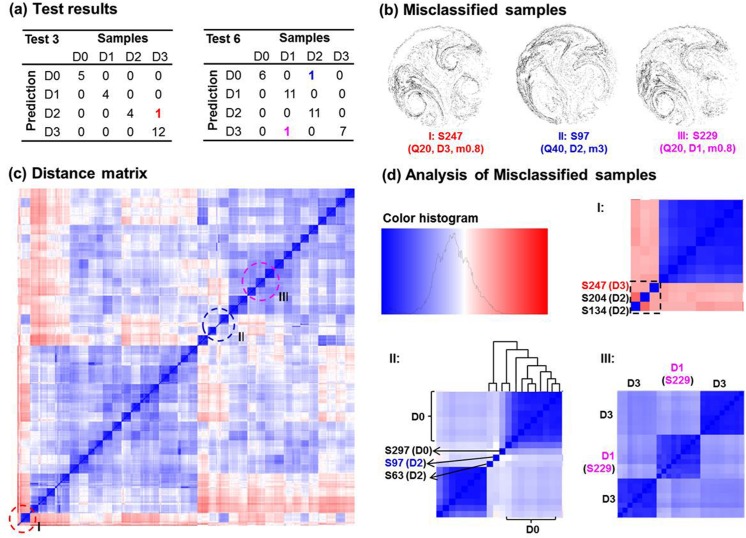
Fig 8. Analysis of misclassified samples in the 324-sample-experiment which has a respiration range of 30±10 L/min and two upper airway variations.
The prediction accuracy is 99.1% with three misclassified samples in total (a). The image, sample number, and test parameters of the misclassified samples are listed in (b). The locations of the three misclassified samples are marked in the distance matrix (c), and their zoom-in plots are shown in (d).

