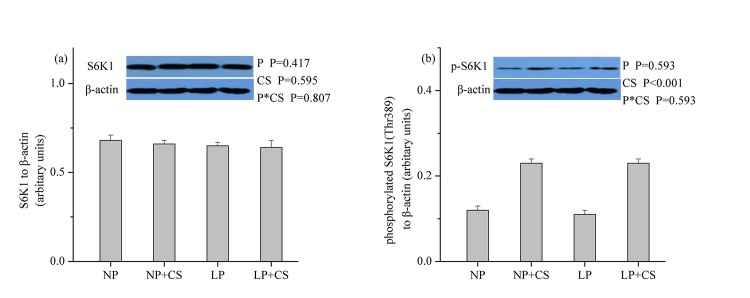
Fig 3. Protein levels of total (a) and phosphorylated (b) p70S6K1 in skeletal muscle.
β-actin was used to normalize the abundance of total and phosphorylated S6K1. Values are means ± SEM. P<0.05 was considered significant difference. Protein levels were analysed with pen as the experimental unit (n = 3). NP, normal protein diet (14% CP); NP+CS, normal protein diet supplemented with cysteamine; LP, low-protein diet (10% CP); LP+CS, low-protein diet supplemented with cysteamine. P, main effect of dietary protein levels; CS, main effect of cysteamine supplementation; P×CS, interaction between main effects of dietary protein levels and cysteamine supplementation.

