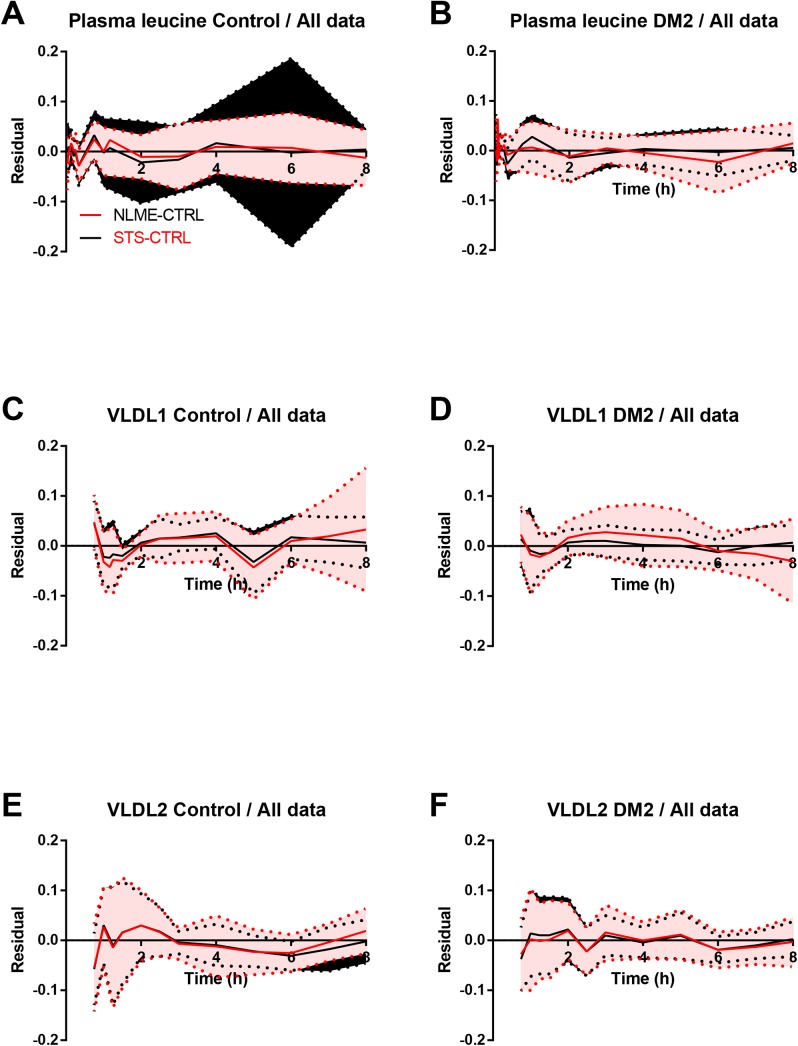
Fig 2. Residual plots of enrichment data using all data.
The residuals (model fit minus measurement data) for the three enrichment data sets (A and B, plasma leucine; C and D, VLDL1; E and F VLDL2) were plotted for the two methods (STS and NLME) and the two groups (A, C and E, Control; B, D and F, type 2 diabetes mellitus (DM2)). Both methods produced good fits to the data. The NLME approach used a sequential procedure; the plasma leucine were fitted first and the VLDL1 and VLDL2 curves were fitted using the leucine results. This may explain the worse fit for the plasma leucine in the STS approach. Lines, mean of mixed effects approach (red) and STS approach (black); Areas, mean ± SD for mixed effects approach (red) and STS approach (black).

