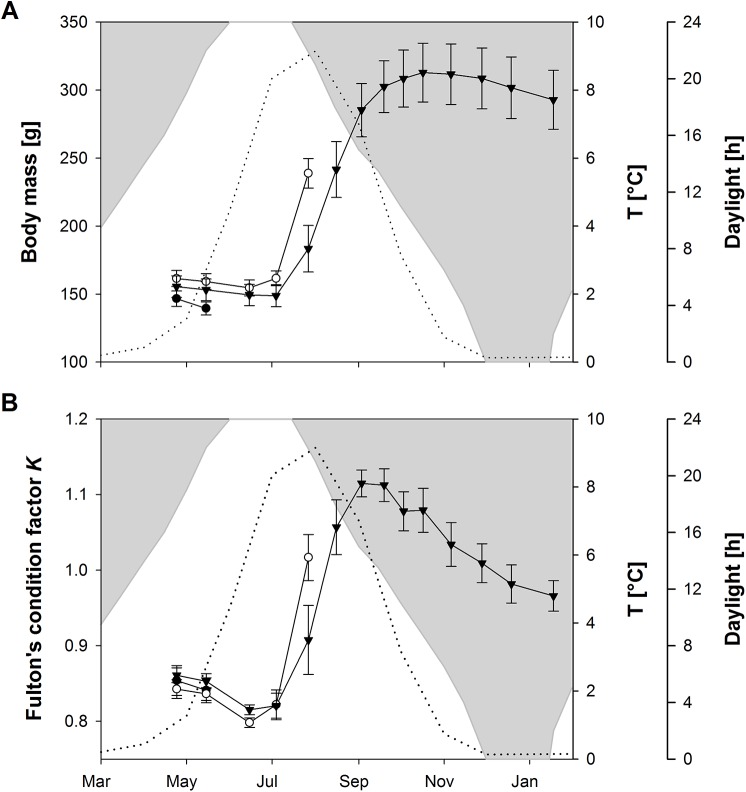
Fig 1. Body mass development (A) and Fulton’s Condition Factor K (B) of the fish sampled for mRNA quantification.
Black dots: Sampled in May 2012, White dots: Sampled in July 2012, Triangles: Sampled in January 2013. Data are presented as mean (n = 10) ± s.e.m. Dotted line: temperature profile. White area: hours of daylight.

