
Figure 1. Ectopic expression of RBM38 increases, whereas knockdown of RBM38 decreases, the level of PPM1D protein.
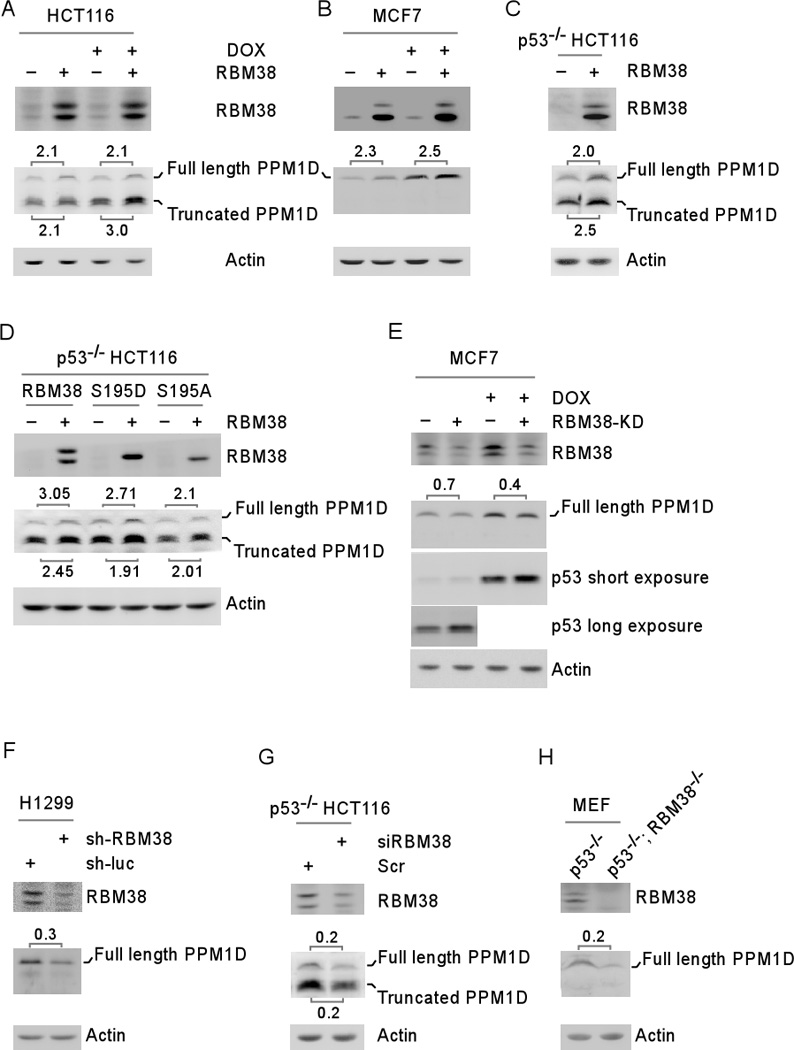
(A–B) The levels of RBM38, PPM1D and actin proteins were measured in HCT116 (A) and MCF7 (B) cells uninduced (−) or induced (+) to express RBM38 for 24 hours, followed by mock-treatment or treatment with doxorubicin (DOX) for 18 h. (C) The levels of RBM38, PPM1D and actin proteins were measured in p53−/− HCT116 cells uninduced (−) or induced (+) to express RBM38 for 24 hours. (D) p53−/− HCT116 cells were uninduced (−) or induced (+) to express HA-tagged wild-type RBM38, S195D, and S195A for 24 h. The levels of RBM38, PPM1D and actin proteins were measured by Western blot analysis. (E) The levels of RBM38, PPM1D, and actin were determined in MCF7 cells uninduced or induced to knock down RBM38 (express a shRNA against RBM38) for 3 days, followed by mock-treatment or treatment with doxorubicin (DOX) for 18 h. (F) The levels of RBM38, PPM1D, and actin were determined in H1299 cells transduced with a lentivirus expressing a control luciferase shRNA (sh-luc) or RBM38 shRNA (sh-RBM38) for 3 days. (G) The levels of RBM38, PPM1D, and actin were determined in p53−/−HCT116 cells transiently transfected with a control or RBM38 siRNA for 3 days. (H) The levels of RBM38, PPM1D, and actin were determined in primary p53−/− and p53−/−; RBM38 −/− MEFs at passage 12.