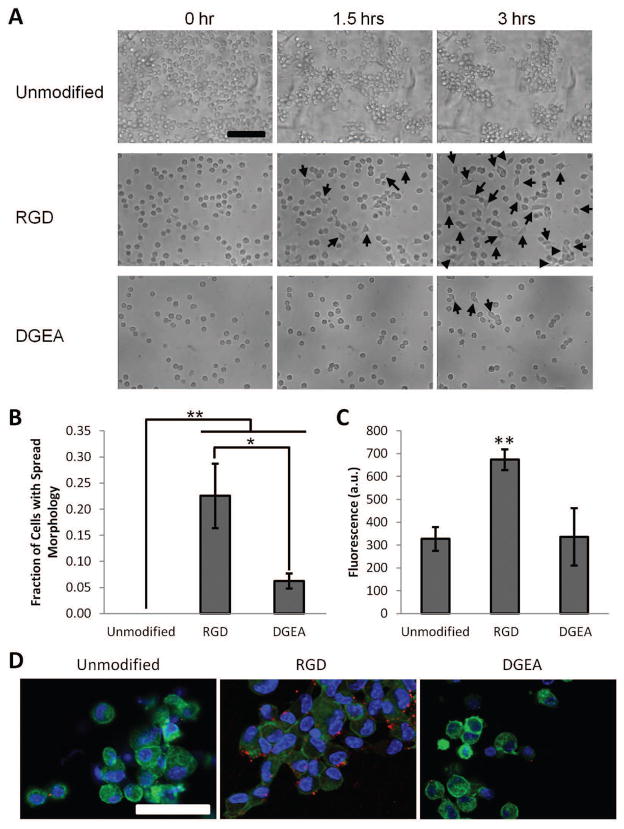
Figure 2. Characterization of D1 Mouse MSC Adhesion to RGD and DGEA Peptide Modified Alginates.
(A). DIC images of D1 MSCs seeded onto unmodified alginate, RGD-modified alginate, or DGEA-modified alginate hydrogels. Cells were maintained in serum free DMEM and imaged over the course of three hours post-seeding. Arrows denote the appearance of spread cells. Scale bar: 100 μm. (B). Fraction of seeded D1 cells adopting a spread morphology three hours post-seeding onto unmodified alginate, RGD-modified alginate, or DGEA-modified alginate hydrogels. *p<0.05, **p<0.01, Student’s t-test, n = 3–4. Error bars are ±SD. (C). Metabolic activity of D1 MSCs seeded onto unmodified alginate, RGD-modified alginate, or DGEA-modified alginate hydrogels, as measured by the PrestoBlue assay, after 3 days in culture. Increased fluorescence corresponds to increased metabolic activity. **p<0.01, Student’s t-test, n = 3. Error bars are ±SD. (D). Immunofluorescence images of D1 MSCs seeded onto unmodified alginate, RGD-modified alginate, or DGEA-modified alginate hydrogels and cultured for 3 hours. Cell nuclei are labeled in blue (Hoechst 33258), actin filaments in green (phalloidin), and phospho-paxillin in red. Scale bar: 50 μm.

