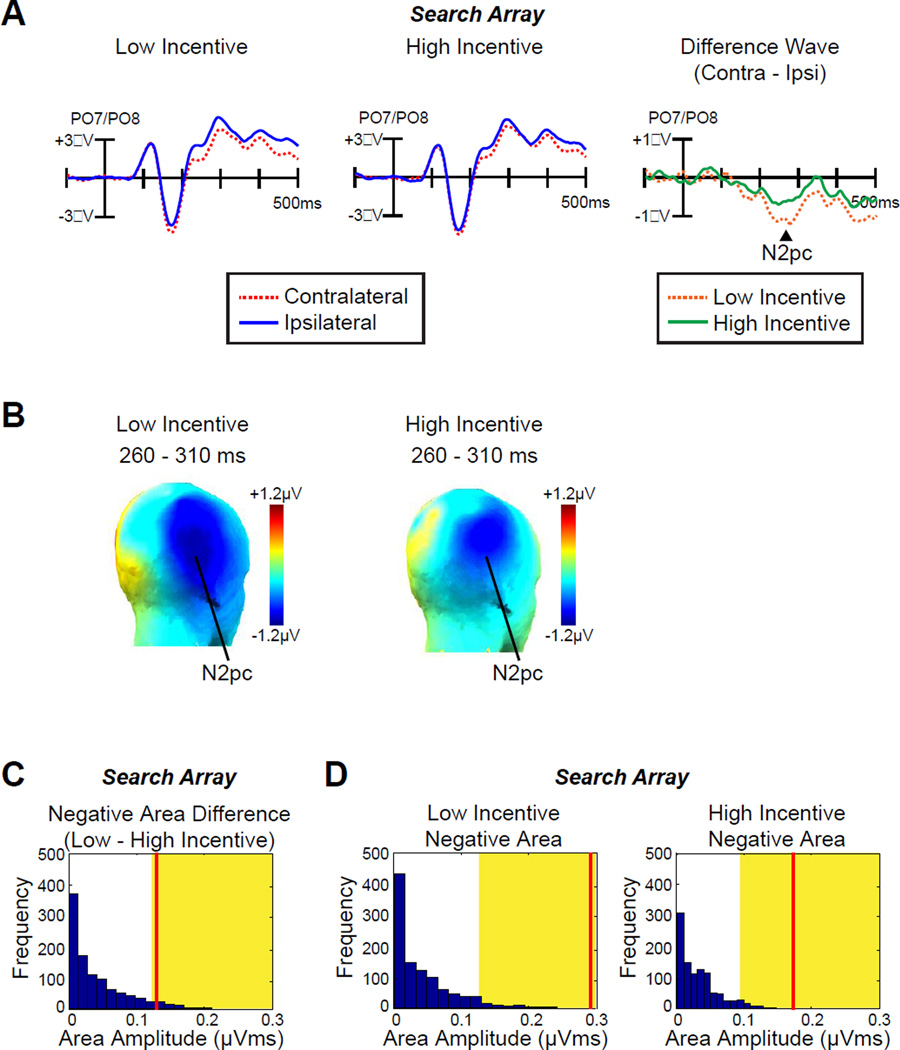
Fig 4.
ERP results from search array. A, Grand average waveforms for low- and high-incentive targets at contralateral versus ipsilateral electrode sites (averaged over PO7 and PO8). The time 0 is the onset of search array. B, Topographic maps of the N2pc component for low- and high-incentive targets. C, Permutation tests of the negative areas difference between low- and high-incentive targets from 100–500 ms. The blue bars indicate the estimated null distribution from 1000 permutations. The yellow areas indicate the top 5% of the permutation distribution. The red lines represent the observed values of the negative area (N2pc) difference between low- and high-incentive targets from the grand average difference waveforms. D, Permutation tests of the negative areas for low- and high-incentive targets from 100–500 ms. The red lines represent the observed values of the negative area (N2pc) from the grand average difference waveforms.

