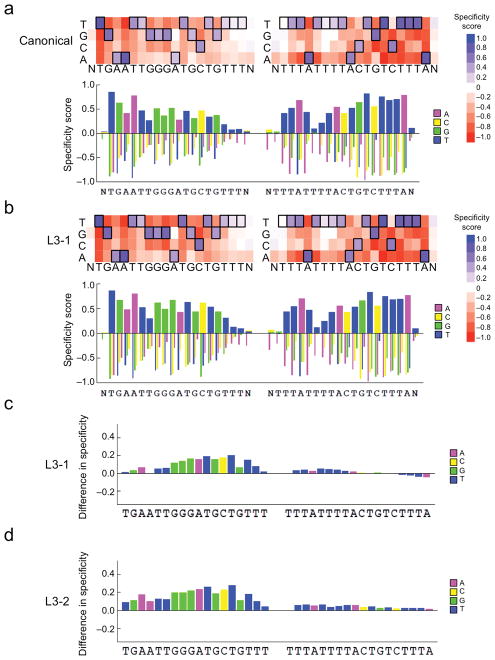
Figure 2. High-throughput specificity profiling of canonical and evolved TALENs.
Top: Heat map showing DNA cleavage specificity scores across > 1012 off-target sequences for either (a) canonical or (b) L3-1 evolved TALENs targeting the ATM locus at each position in the left and right half-sites plus a single flanking position (N). Bottom: Bar graph showing the quantitative specificity score for each nucleotide position. A score of zero indicates no specificity, while a score of 1.0 corresponds to perfect specificity. (c) Bar graph indicating the quantitative difference in specificity score at each position between the canonical and L3-1 evolved TALENs (scoreL3-1-scorecanonical) at each position in the target half-sites plus a single flanking position (N). A score of zero indicates no change in specificity. For all heat maps, the cognate base for each position in the target sequence is boxed. For the right half-site, data for the sense strand are displayed. (d) Identical to (c), except for the L3-2 evolved TALEN versus the canonical TALEN.

