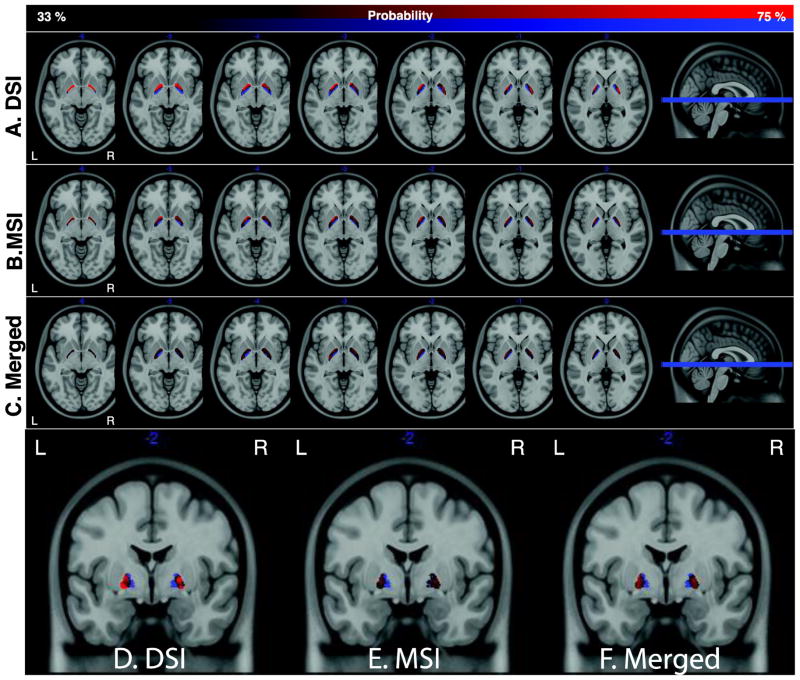
Fig. 8.
A–C. Probabilistic maps, across subjects, of the inner and outer segments in the DSI (A), MSI (B), and merged (C) datasets. Maps are thresholded between 33–77% probability. The background image in each image is the T1 ICBM template. Axial images span z coordinates [−6,0]. D–F. Coronal images of the same probabilistic maps at y = −2.

