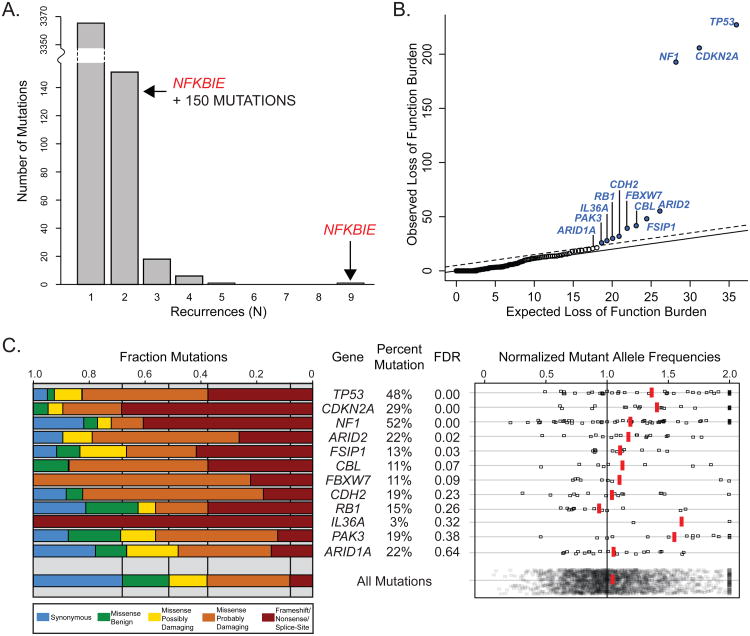
Figure 2. Nomination of driver mutations in desmoplastic melanoma.
A. The number of specific mutations detected (y-axis) is stratified by those mutations' occurrences across samples (x-axis). For example, 3,364 mutations occurred only once, whereas there were 151 mutations occurring in two samples and a single mutation was observed 9 times, affecting the NFKBIE genetic locus. There was also a secondary hotspot in NFKBIE, 15 basepairs from the more common mutation site, which was mutated in two samples. B. Q-Q plot of loss-of-function burdens compared to expected loss-of-function burdens, calculated as described. Solid and dotted lines correspond to false discovery rates (FDRs) of 1.0 and 0.5, respectively. The most significant genes are labeled. C. Tumor suppressor candidates have an increased proportion of damaging mutations and fully clonal mutant allele frequencies (MAFs), undergoing loss of heterozygosity in some cases. Left panel: Fraction of mutation categories compared to all mutations. Right panel: Normalized MAFs (calculated as described) of candidate mutations compared to all mutations. Red vertical bars indicate average MAFs.

