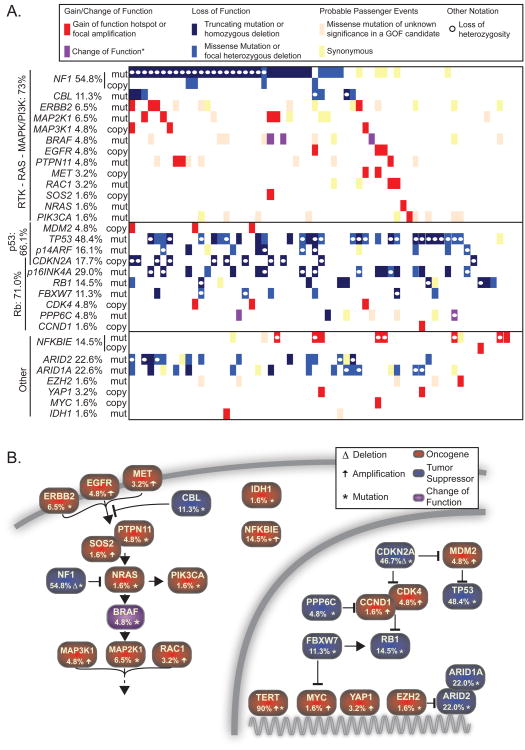
Figure 5. The mutational landscape of desmoplastic melanoma.
A. Tiling plot of genetic alterations (rows) in each sample (columns). Mutations were considered homozygous if their MAFs were 1.5× the sample median. Numbers indicate the percent of samples harboring oncogenic alterations. Purple (*) tiles indicate unique hotspot mutations as discussed. GOF = gain-of-function. B. Pathways affected.

