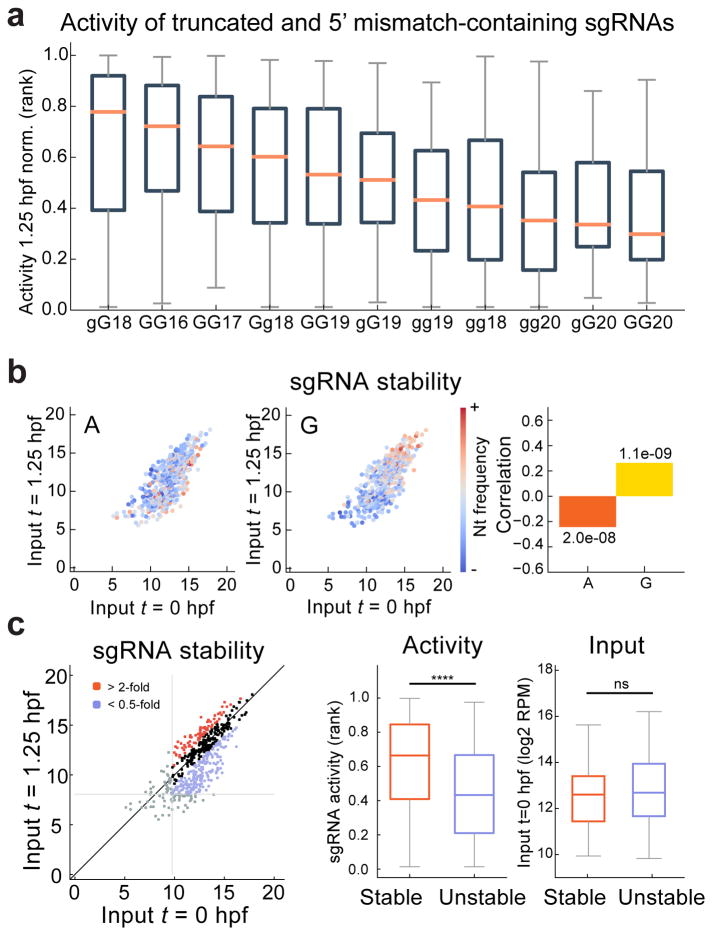
Figure 4. Extending the CRISPR target repertoire with truncated, extended and 5′ mismatch-containing sgRNAs.
a. Boxplot representing the ranked normalized activity of each class of alternative sgRNAs, ordered by median activity. Shorter sgRNAs (GG16 and GG17) and sgRNAs inducing 1 mismatch in the 5′ GG (gG18 and Gg18) are the most active alternatives to the canonical GG18 sgRNA.
b. Biplot of sgRNA levels (log2 RPM) comparing 0 and 1.25 hpf, colored to indicate the frequencies of A and G in each sgRNA. Corresponding Spearman correlations between nucleotide frequencies and sgRNA stability (ratio of 1.25 hpf to 0 hpf levels) are shown (right), with p values indicated.
c. Biplot illustrating stable and unstable groups of sgRNAs, defined by >2-fold enrichment or depletion between 0 and 1.25 hpf (log2 RPM) (left). sgRNAs with low read-counts (bottom 10%) were excluded (grey lines). Box and whisker plots showing sgRNA activity (middle) and the input levels (right) in the stable and unstable sgRNAs. Mann-Whitney U test (**** p< 0.0001, ns: not significant).

