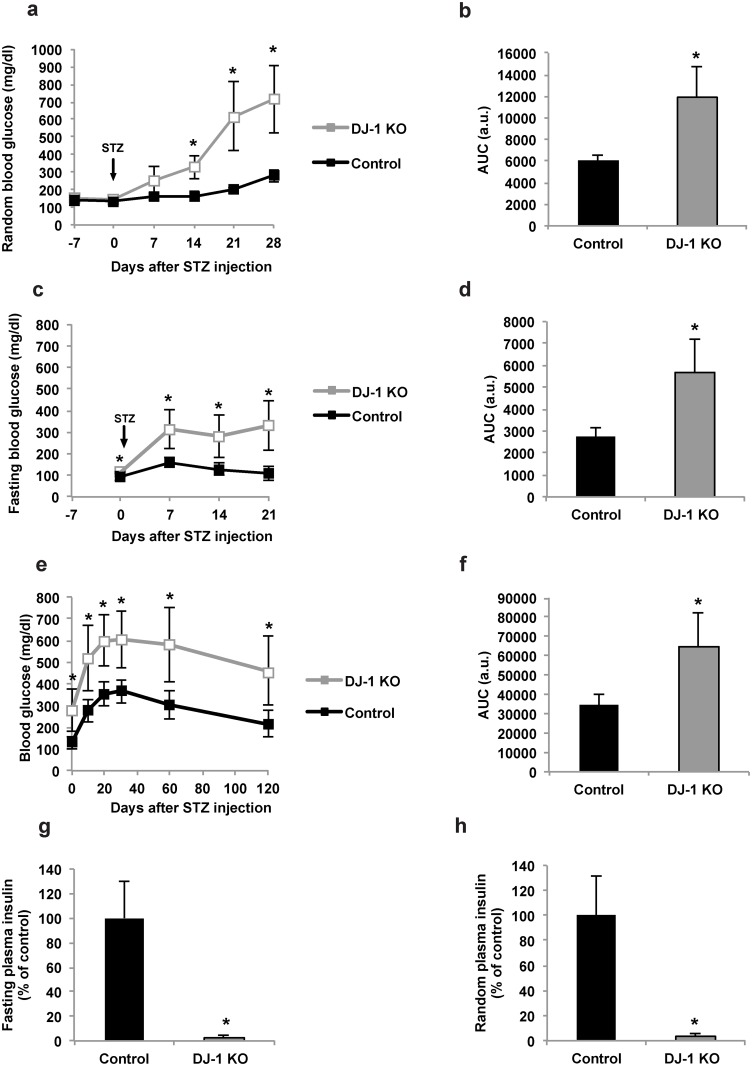
Fig 1. MLDS treatment induces a diabetic phenotype in the absence of DJ-1.
Male control and DJ-1 KO mice at 12–13 weeks of age were treated with 40 mg STZ/kg body weight on five consecutive days. Blood glucose concentrations, glucose tolerance, and plasma insulin concentrations were determined. (a,c) Random (a) and fasting (c) blood glucose concentrations in control (black squares) and DJ-1 KO mice (grey squares). n = 6–8 mice per experimental group. (b,d) Corresponding areas under the curve (AUC) to (a,c) are shown for control (black columns) and DJ-1 KO (grey columns) mice each. (e,f) Glucose tolerance test (e) and its corresponding AUC (f) in 14–16 weeks-old control (black squares and black column) and DJ-1 KO mice (grey squares and grey column). The glucose tolerance test was performed after intraperitoneal administration of glucose (1 g/kg body weight). n = 8 mice per experimental group. (g,h) Relative fasting (g) and non-fasting (h) plasma insulin concentrations in 14–16 weeks-old control (black columns) and DJ-1 KO mice (grey columns) normalised to controls. n = 8 mice per experimental group in (g) and n = 5 in (h). *p<0.05 (Student’s t-test in b, d, f-h. Student’s t-test with Holm-Bonferroni correction in a, c, e). All values are means ± SD.

