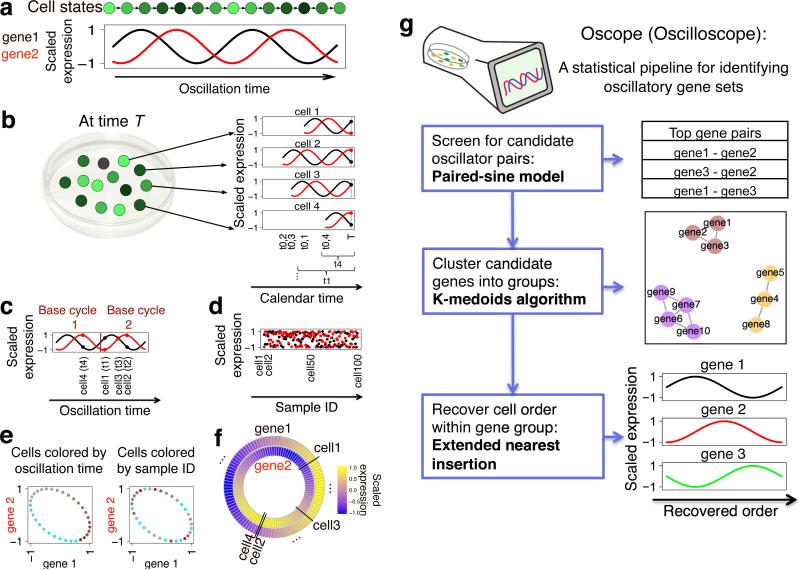
Figure 1.
Overview of Oscope. (a) Shown are an oscillating gene group with two genes and corresponding cell state. (b) In an unsynchronized scRNA-seq experiment, mRNA is collected at time T from cells in varying states. t0,i and ti show cell i's oscillation start time and oscillation time, respectively. (c) The same genes and cells as in b, where cells are ordered by the genes’ oscillation times. (d) Expression for 100 unsynchronized cells. (e) Scatter plots of gene 1 vs. gene 2, which are independent of order. Cells are colored from cyan to brown following the x-axes of c and d, respectively. (f) Results of base cycle reconstruction for the 100 cells shown in d. (g) Flowchart of the Oscope pipeline (see Online Methods).

