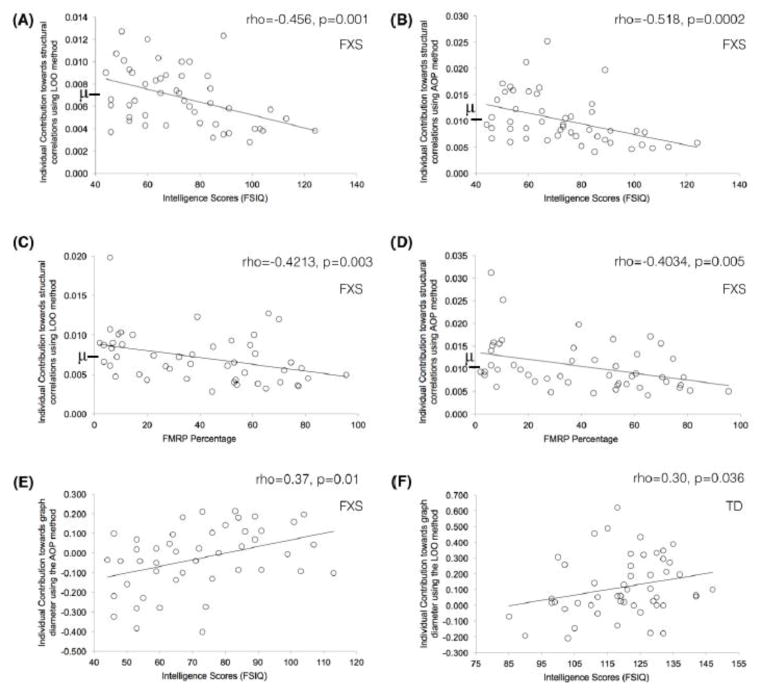
Figure 2.
Relations observed between extracted contributions and behavioral/genetic measures. The symbol \mu and bold line on y-axis, in A–D, depicts group-mean of individual contribution and it is shown to provide information regarding position of each individual’s contribution with respect to the group mean. Full dataset was used for these correlations and Spearman rank correlation values (rho) are reported.

