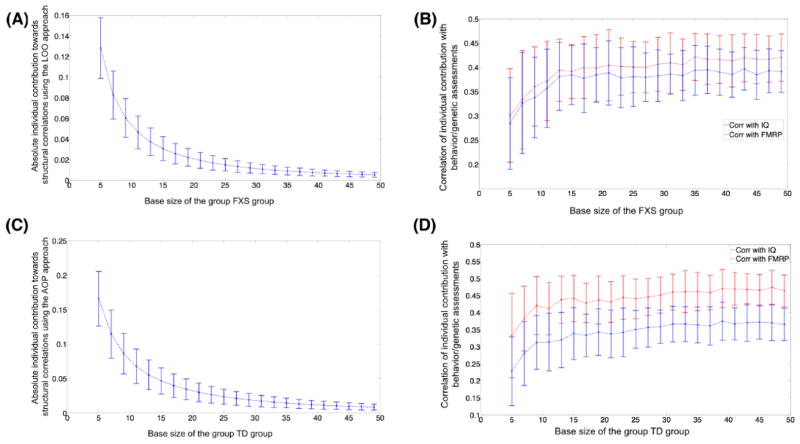
Figure 4.
Stability analysis to test the effect of increase in number of participants on the magnitude of individual contribution and on the correlation between individual contribution and behavioral/genetic measures. As evident, across groups, with increasing number of participants, the individual contribution exponentially decreases. However, the correlation between contribution and behavior/genetic scores asymptotically increases and stabilize around n=25–30. Similar pattern was evident for the network properties (e.g., diameter). Absolute value of individual contribution in used in A and C and the error bars represent standard error of the mean. Spearman rank correlation (rho) was used to estimated correlation between individual contribution and behavioral/genetic measures.

