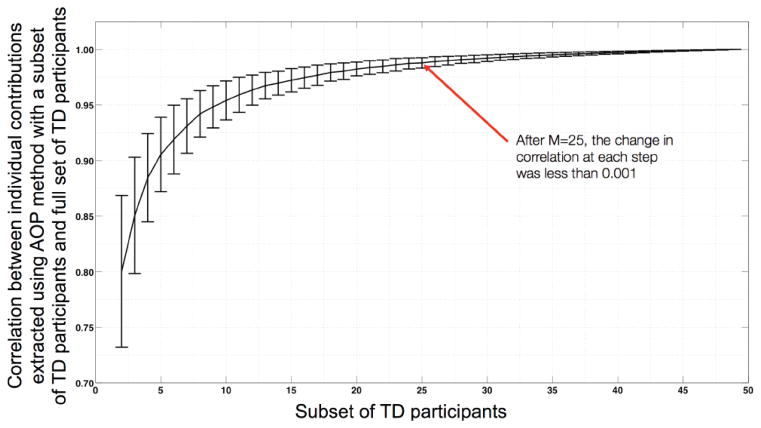
Figure 5.
Number of TD participants required for stable estimation of individual contribution based on AOP approach for all participants in the FXS group. Graph was generated by randomly selecting subsets (of different size M) from TD participant pool. Repeating this random selection process 1000 times generated the error-bars on the graph. The error bars represent standard error of the mean. Y-axis depicts Spearman rank correlation (rho) values.

