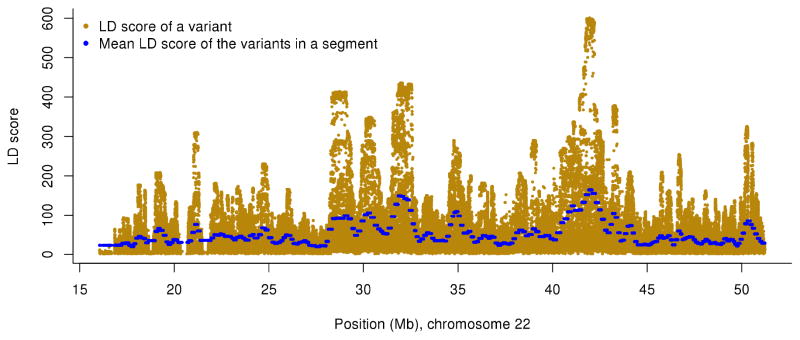
Figure 2.

Fitting region-specific LD heterogeneity of the genome using a sliding-window approach. Shown are the results for chromosome 22 from the UK10K-WGS data as example. LD score of each variant is defined as the sum of LD r2 between the target variant and all variants (including the target variant) within ±10Mb distance. For the GREML-LDMS analysis, the region-specific LD heterogeneity is fitted by segments with average length of 100Kb (the dots in blue) using a sliding window approach as described in Online Methods.
