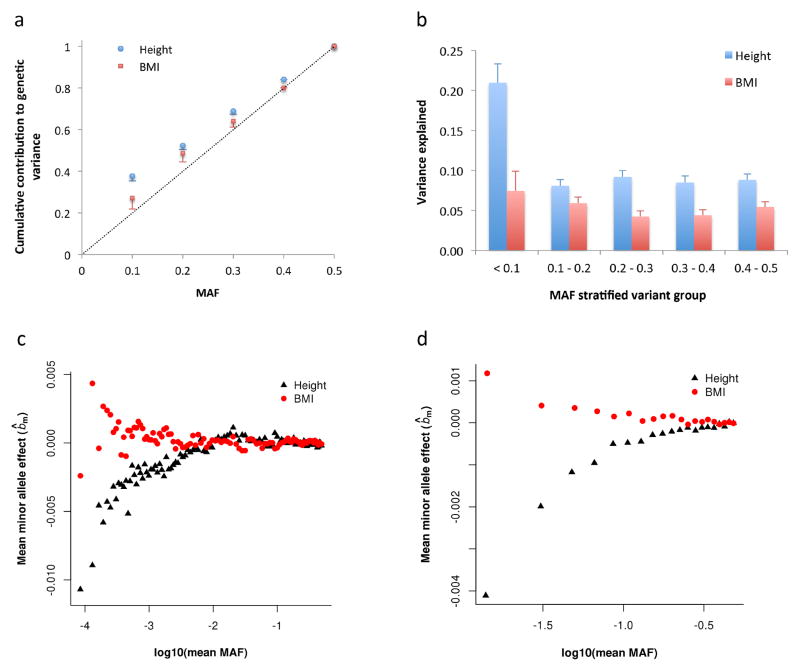
Figure 4.
Evidence for height- and BMI-associated genetic variants being under natural selection. Results shown in panels (a) and (b) are from the GREML-LDMS analyses (Online Methods). Panel (a): the estimate of cumulative contribution of variants with MAF ≤ θ to the genetic variance, i.e. . The dash line represents that expected under a neutral model. Panel (b): the estimate of for variants in each MAF group. Error bar is s.e. of the estimate. Results shown on panel (c) are from genome-wide association analyses in the combined data set (Online Methods). bm is defined as the effect size of the minor allele of a variant. Variants are stratified into 100 MAF bins (100 quartiles of the MAF distribution). Plotted is the mean of b̂m against log10(mean MAF) in each bin. The correlation between mean b̂m and log10(mean MAF) is 0.77 (P < 1.0×10⁻⁶) for height and −0.39 (P = 8.0×10⁻⁶) for BMI. Shown on panel (d) are the results from the latest GIANT consortium meta-analyses for height5 and BMI22 (see Web Resources) for common SNPs (MAF > 0.01). There are ~2.5M SNPs stratified into 20 MAF bins. The correlation between mean b̂m and log10(mean MAF) is 0.89 (Ppermu < 1.0×10⁻⁶) for height and −0.87 (Ppermu < 1.0×10⁻⁶) for BMI. The mean b̂m seems smaller in panel (c) than that in panel (d) because of the smaller MAF range of each bin and larger number of variants in each bin in panel (c) than those in panel (d).

