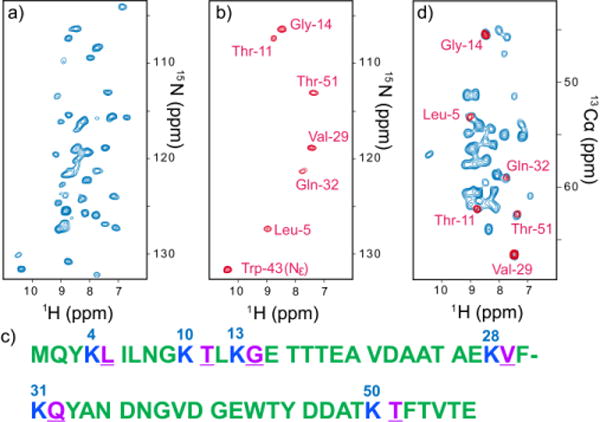
Fig. 1.

(a, b) 2D 1H-detected 15N/1H correlation spectra (a) without and (b) with HIGHLIGHT REDOR for the micro-crystalline sample of Lys-reverse-labeled GB1, along with the sequence shown in (c). (d) 2D 1H-detected CA(N)H correlation spectra (blue) without and (red) with HIGHLIGHT REDOR, for the same sample. The sample was doped with 20 mM Cu-EDTA. The data were collected with recycle delays of 1 s at a spinning speed of 80,000 ± 5 Hz. The dephasing time due to 13CO-15N for HIGHLIGHT REDOR was 4.2 ms. The pulse sequences for the HIGHLIGHT experiments used for (b, d) are shown in Fig. S2 and S3.
