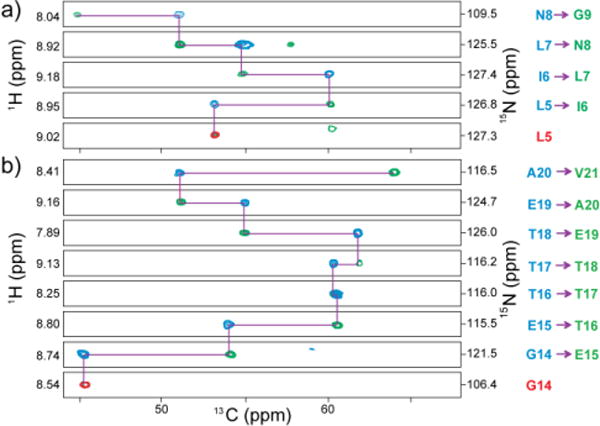
Fig. 2.

Overlaid 3D strip plots for sequential assignments from (a) Leu-5 through Gly-9 and (b) Gly-14 through Asp-22 for a micro-crystalline sample of Lys-reverse-labeled GB1 protein obtained by 3D CANH (green), CA(CO)NH (blue), and 3D CANH with 4.2 ms HIGHLIGHT REDOR mixing data (red). The recycle delays were 0.3 s, 0.4 s, and 1 s for 3D CANH, 3D CA(CO)NH, and 3D CANH with HIGHLIGHT REDOR, respectively. All experiments were performed at a MAS spinning speed of 80 kHz with ~0.5 mg of sample. The total experimental times were 20 min for 3D CANH, 3.7 h for 3D CA(CO)NH, and 1 h for 3D CANH with HIGHLIGHT REDOR (for details, see the Experimental section and Fig. S2).
