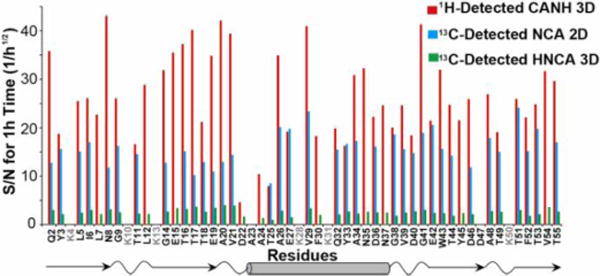
Fig. 3.

A comparison of signal-to-noise (S/N) ratios of 2D slices from 1H-detected 3D CANH correlation (red bars), 13C-detected 2D NCA correlation (blue bars), and 13C-detected 3D HNCA correlation (green bars) of the GB1 sample. All the ratios were normalized to an experimental times of 1 h. The S/N ratios were normalized to the root-square of the experimental time. The secondary structures at the bottom were obtained from a published structure (PDB id: 2QMT).18 The S/N ratios for the overlapping peaks in the 2D NCA data are not shown. The average S/N ratios for an hour of the experimental time were 27.5, 15.2, and 2.6 for 3D CANH, 2D NCA, and 3D HNCA spectra, respectively.
