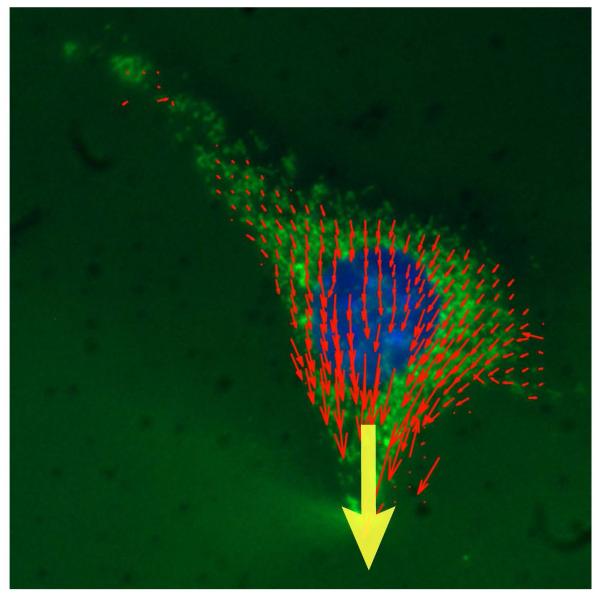
Figure 3.
Representative displacement vector map of induced cytoskeletal deformations in a microneedle manipulation assay. Precisely controlled localized strain was applied with a microneedle near the nucleus towards the cell periphery (yellow arrow). Final cytoskeletal displacements (red vectors) were computed by tracking fluorescently labeled mitochondria (Mitotracker Green) during force application. The fibroblast nucleus was labeled with Hoechst 33342 nuclear stain (blue). Shown are the final displacements at the end of the localized strain application. Vector length shown at 2× magnification for clarity.

