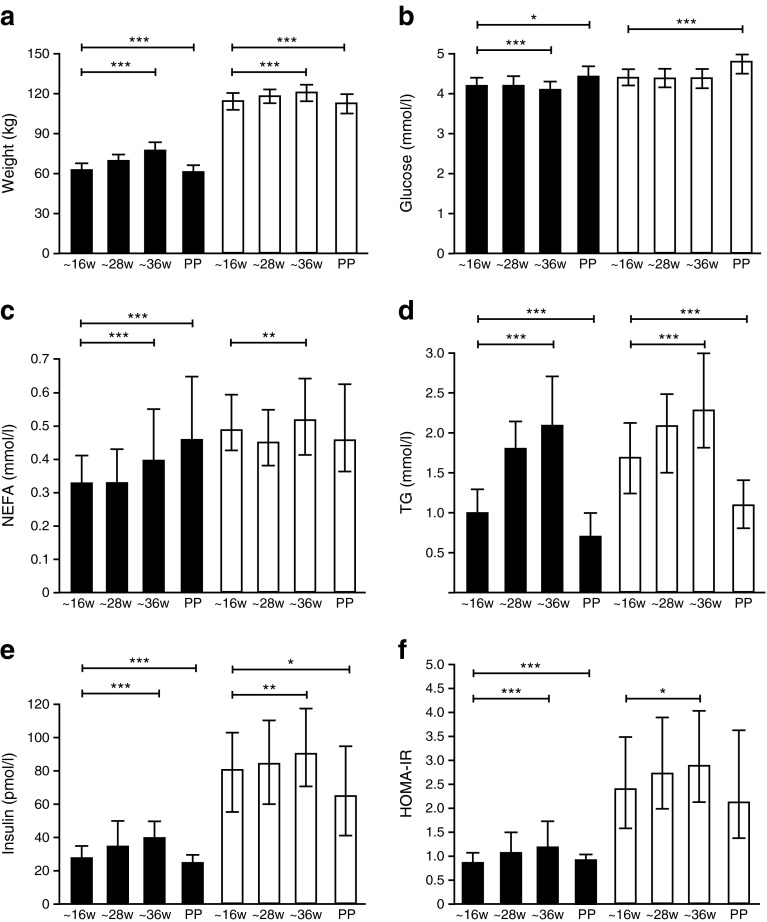
Fig. 1.
Weight and metabolic data of NGT obese and lean control participants. Data at early (~16 weeks [w]) (n = 190, obese [white bars], n = 118 lean [black bars]), mid (~28 weeks) and late (~36 weeks) gestation and postpartum. (a) Weight, (b) glucose, (c) NEFA, (d) TG, (e) insulin and (f) HOMA-IR. Median ± IQR demonstrated at each visit. Repeated ANOVA analyses were performed from the three visits during pregnancy and again on the four visits including the postpartum (PP) visit. *p < 0.05, **p < 0.01, ***p < 0.001

