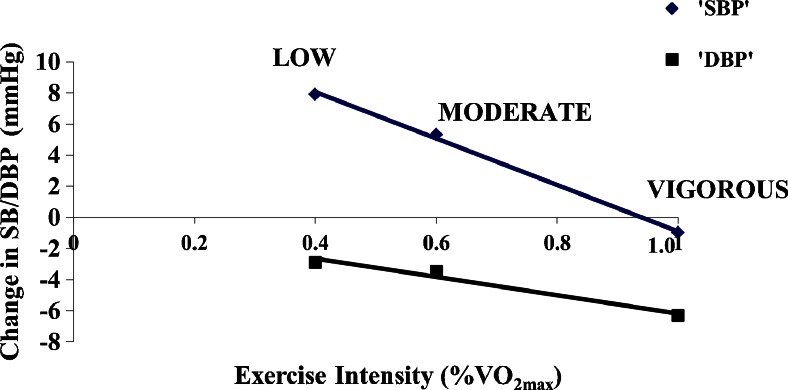
Fig. 2.
Linear regression of the average blood pressure change from baseline following low, moderate, and vigorous intensity exercise. SBP systolic blood pressure. DBP diastolic blood pressure. VO2max maximum oxygen consumption. Black diamond suit indicates SBP, y = -14.9x + 14.0, R 2 = 0.998. Black square indicates DBP, y = -5.9x–0.3, R 2 = 0.969 (ps < 0.01). Adapted from reference [42]

