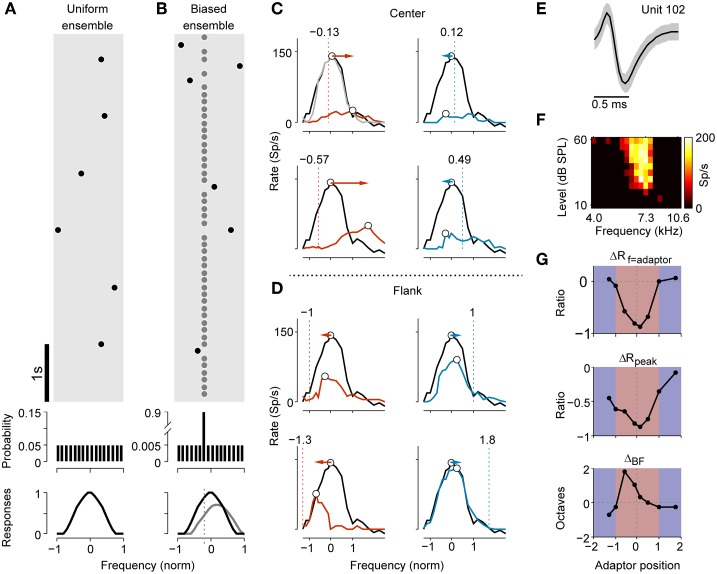
Figure 1.
Stimulus paradigm and adaptive change of frequency tuning in an example neuron. (A) A segment of the stimulus sequence in the uniform ensemble. Each dot symbolizes a tone. In the entire sequence, the probability distribution of presentation across frequencies was flat (middle panel). The non-adapted frequency-tuning curve to the sequence is illustrated in the bottom panel. (B) Stimulus sequence for a biased stimulus ensemble. The frequency probes (black dots) were selected in the same way as in the uniform ensemble, except that they were randomly interspersed in a repeating frequency adaptor (gray dots). The presentation probability of the adaptor was 90%. The bottom panel displays a hypothetic tuning curve for both the original (black) and adapted case (gray). (C) Comparison of non-adapted (black) and adapted tuning (colored) with adaptors close to the original BF (center adaptor) of an example neuron. The dashed lines and texts above annotate the normalized frequency of the adaptor (adaptor position). The frequency of the adaptor was below (red) or above (blue) the original BF. The light gray curve in the top left panel shows a second measurement of the non-adapted tuning after 30 s of recovery. The BFs in both non-adapted and adapted tuning are marked as open circles. The colored arrows show the shift directions of the BFs, which were repulsive during adaptation. (D) Comparison of the non-adapted and adapted tuning when the adaptors were located on the far flank of the RF (flank adaptor). Using the same conventions as in (C), the BFs shifted attractively toward the adaptors during adaptation. (E) The averaged spike waveform (mean ± SD) of the example neuron during a segment of recording. (F) FRA of this neuron (bandwidth of 30 dB above threshold, BW30 = 0.31 octave, Q10 = 6.32, CF = 7.26 kHz). (G) The relative changes in the adaptor response (top, ΔRf = adaptor), peak response over all frequencies (middle, ΔRpeak) and shift magnitude of the BF (bottom, ΔBF) vary with the adaptor position. A positive ΔBF indicates a repulsive shift while a negative one represents an attractive shift.

