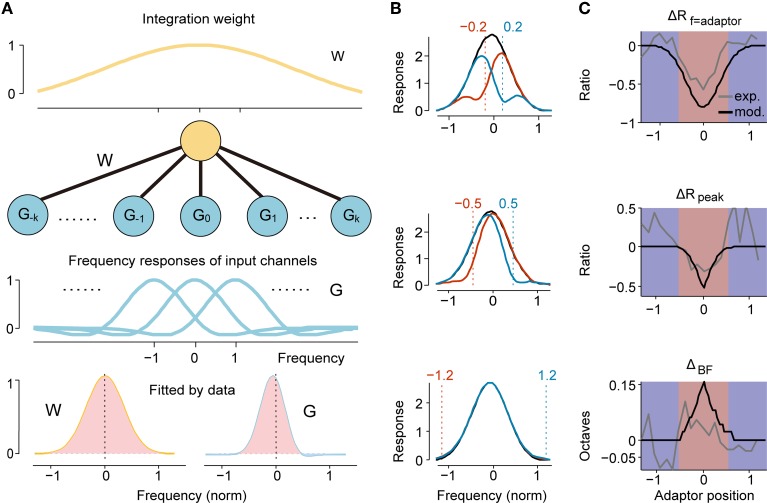
Figure 4.
Two-layer feedforward network model predicted RF Change. (A) The architecture of our two-layer feedforward network. The upper neuron integrates weighted inputs (W function, yellow line in top panel). Each channel in the lower input layer has a specific frequency response organized tonotopically (G function, blue lines). When a specific frequency is repeatedly presented, the input from the adaptor channel is suppressed, resulting in a change in the output as observed in the upper layer neurons. Both W and G are modeled as Gabor functions with individual parameters. Bottom: the W function and G function with parameters fitted by experimental data of narrowly tuned neurons. Light red and light blue indicate excitatory and inhibitory sub-regions, respectively. (B) The simulated adapted (colored) and original tunings (black) by six different adaptors qualitatively depict the experimental observation. The normalized frequency of each adaptor is annotated with a dashed line and the text above it. (C) The profile of the ratio of change in adaptor response (top), peak response (middle) and shift magnitude (bottom) with respect to the adaptor position from model simulation (black) and the experiment (gray) match well in the overall center-surround pattern.

