Figure 5.
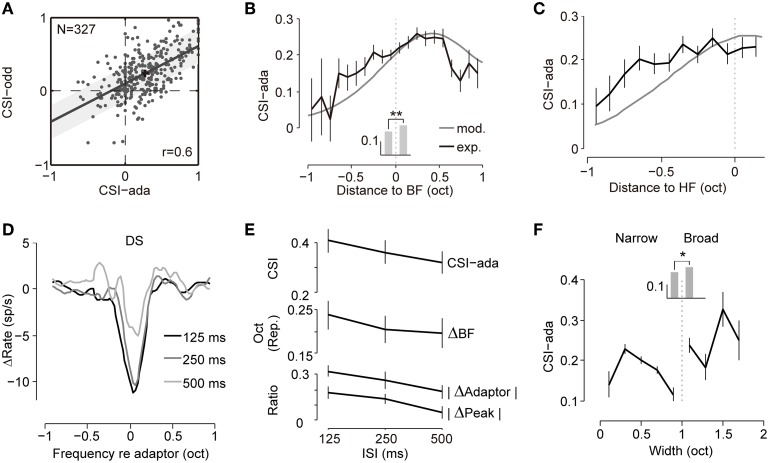
The adaptive frequency response predicts the SSA. (A) Scatter plot showing CSIs measured with a biased ensemble (CSI-ada) and oddball sequence (CSI-odd) were significantly correlated (Pearson's r = 0.602, p = 1.25 × 10⁻³³). The best-fit linear regression line is shown (least square, slope = 0.52). The shadow bounds the 95% confidence interval. The black cross represents the mean value of the dot clusters. (B) Averaged CSIs (CSI-ada) calculated from both adapted tunings (black) and the model (gray) as functions of the center of the tested frequency pair (relative to the BF). The curve from the model (maximal value: 0.61) was rescaled to match the maximal value of the curve from the experiment (0.26) for display only. Mean CSIs at frequencies below and above the BF are displayed as bars in the middle. The asterisks indicate that CSIs in the high-frequency group were significantly larger than in the low-frequency group (Wilcoxon rank sum test, p = 1.5 × 10⁻⁴). (C) CSIs were grouped according to the frequencies relative to the high-frequency (HF) edge of each cell. Higher CSI values are clearly skewed toward the higher edge. The same conventions as in (B). (D) Averaged DSs under three ISIs (125, 250, and 500 ms, coordinated to the adaptor before averaging, n = 48) showing greater local suppression under a shorter ISI. (E) The dependence of CSI-ada (top), BF repulsive shift magnitude (ΔBF, middle), suppression magnitude of the peak (|ΔRpeak|, bottom) and adaptor response (|ΔRf = adaptor|, bottom) on the ISI. It displayed a trend of decreasing effect with increases in the ISI. Spearman's correlation between ISIs and the parameters are -0.08, -0.04, -0.13, -0.15 for CSI-ada, ΔBF, |ΔRpeak|and |ΔRf = adaptor|respectively. (F) Dependence of CSI-ada on the bandwidth. The mean values for narrowly and broadly tuned neurons are compared as bars in the middle. Asterisk shows that broadly tuned neurons exhibited higher SSA degrees (Wilcoxon rank sum test, p = 0.038). All error bars indicate the mean ± SE.

