Figure 6.
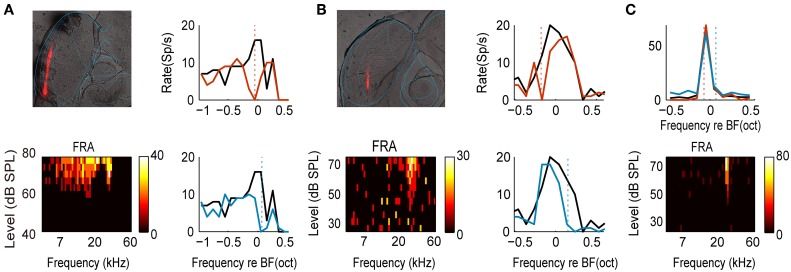
The examples of two recording sites and a non-adapted neuron. (A) An example of recording site in external cortex of IC. Top left: brain section (60 um). Red track: DiI red fluorescent mark of electrode track. Blue: rat brain atlas outline (adapted from Paxinos and Watson, 2007). Bottom left: FRA of one example neuron from this site (CF = 17.3 kHz, BW25 = 2.66 octaves). Right: frequency tuning curves measured with uniform (black) and biased ensemble (colored) with two adaptors. The dashed vertical lines indicate the adaptor positions. (B) An example of recording site in central nucleus of IC. Same convention as in (A). CF = 28.1 kHz, BW30 = 0.70 octave. (C) An example of non-adaptive neuron. Top: frequency tuning curves measured with uniform (black) and biased ensemble (colored) with two adaptors. The dashed vertical lines indicate the adaptor positions for corresponding colored curves. Bottom: FRA of this neuron (CF = 26.6 kHz, BW30 = 0.16 octaves).

