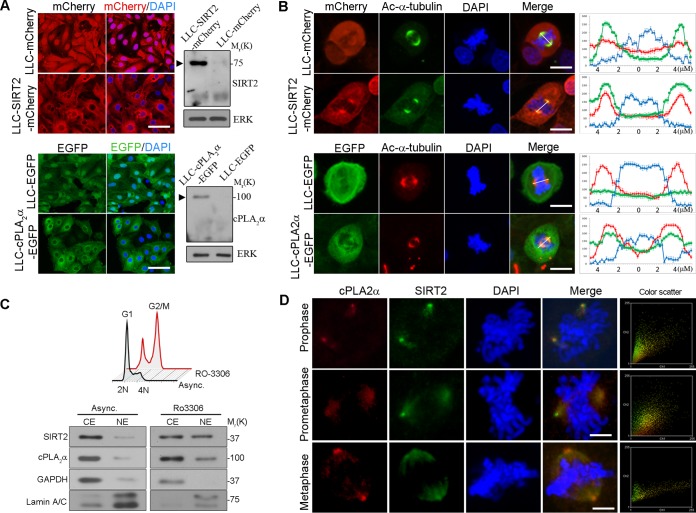
FIG 2.
cPLA2α and SIRT2 colocalize to the mitotic spindles during mitosis. (A) Cellular localization of SIRT2-mCherry and cPLA2α-EGFP in stably transfected LLC-PK1 cells (left panels). LLC-mCherry and LLC-EGFP cells were generated as controls. DNA was stained with DAPI (blue). Scale bar, 50 μm. At right, Western blotting confirmed expression of SIRT2-mCherry and cPLA2α-EGFP fusion proteins (arrowheads) in LLC-cPLA2α-EGFP and LLC-SIRT2-mCherry cells, respectively. (B) Confocal images show the locations of SIRT2 and cPLA2α during mitosis in LLC-SIRT2-mCherry and LLC-cPLA2α-EGFP cells, respectively. Costaining with Ac-α-tubulin antibody shows the colocalization of the two proteins with mitotic spindles. The graphs represent signal intensity scans along the lines drawn. Scale bar, 10 μm. (C) HEK293 cells were arrested at the G2/M boundary by RO-3306 (upper panel). Cells were fractionated into cytoplasmic extracts (CE) and nuclear extracts (NE) (lower panel). Western blotting was performed using the indicated antibodies. (D) HEK293 cells were immunostained with antibodies against cPLA2α and SIRT2, followed by DAPI staining. Colocalization of SIRT2 and cPLA2α in prophase, prometaphase, and metaphase appears as yellow in the merge. Scale bar, 5 μm. Intensity correlation analyses are represented by the color scatter plots of the paired intensities of the red and green channels using ImageJ. Asynch, asynchronous.

