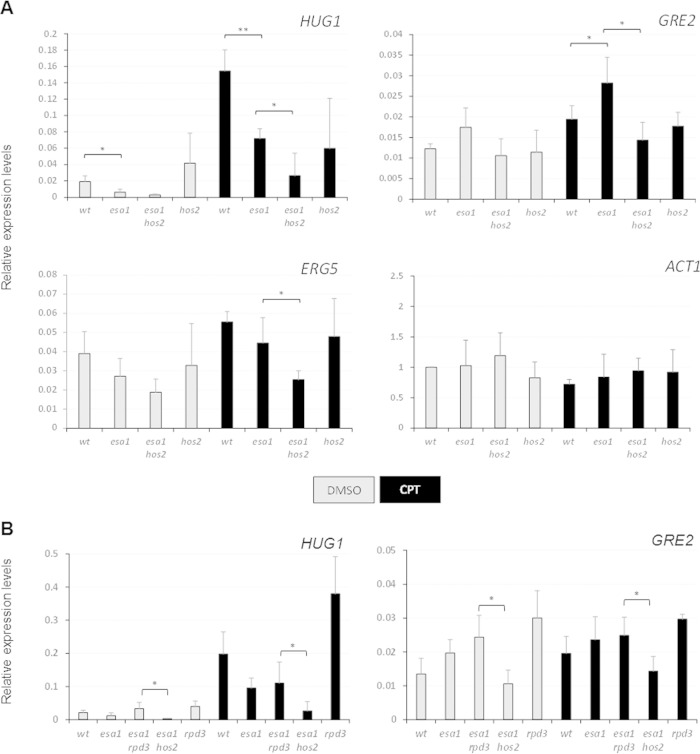
FIG 4.
Expression of DNA damage response genes was aberrant in esa1 cells. (A) Gene expression was analyzed in samples treated with DMSO or with 20 μg/ml of CPT for 90 min. The patterns of expression of the damage-activated genes HUG1, GRE2, and ERG5 and the control gene ACT1 are shown for wild-type (LPY6497), esa1-531 (LPY14757), esa1-531 hos2Δ (LPY14761), and hos2Δ (LPY14577) strains. The expression values were normalized to ACT1 expression. Three independent RNA samples were reverse transcribed and analyzed by qPCR with primers in Table S3 in the supplemental material. Student's t test was used to assess statistical significance, represented with asterisks as follows: *, P < 0.05, and **, for P < 0.01. (B) HUG1 and GRE2 expression levels upon damage were similar in esa1 and esa1 rpd3Δ strains but distinct from that in the esa1 hos2Δ strain. Gene expression was analyzed in samples treated with DMSO or with 20 μg/ml of CPT for 90 min. The expression values were normalized to ACT1 expression. Expression was analyzed in wild-type (LPY6496), esa1-531 (LPY14757), esa1-531 rpd3Δ (LPY21450), esa1-531 hos2Δ (LPY14761), and rpd3Δ (LPY13426) strains.

