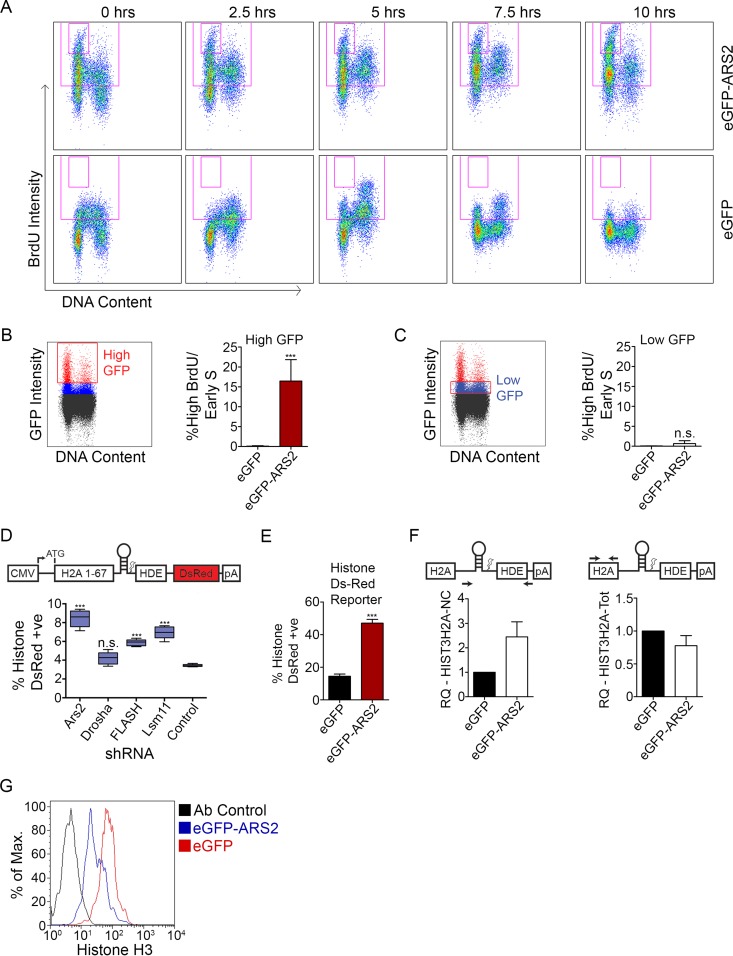
FIG 2.
ARS2 dominant negative affects histone mRNA processing and expression. (A) C2C12 myoblasts transfected with eGFP-ARS2 and eGFP were given a 30-min BrdU pulse, fixed every 2.5 h, and labeled with PI to measure DNA content, and BrdU-positive cells were tracked over time. Cells were gated for GFP; total BrdU-positive events are in the large gate, and high-BrdU/early-S phase cells are in the small inset gate. (B) Cells treated as for panel A were gated for high GFP intensity (red gate). The graph shows the percentage of high-GFP gated cells (average percentage of each time point) contributing to the high-BrdU/early-S-phase-arrested population. (C) Cells treated as for panel A were gated for low GFP intensity (red gate). (D) Cells were cotransfected with shRNA containing a TurboGFP (tGFP) cassette and a histone DsRed reporter that expresses DsRed upon disrupted processing (8, 19). The percent double positive (DsRed and GFP) is shown relative to total transfected cells. (E) Cells were cotransfected with eGFP or eGFP-ARS2 and the histone DsRed reporter and the percent double positive was quantified as for panel D. (F) Noncleaved HIST3H2A (left) and HIST3H2A-Total (Tot) mRNAs (right) were quantified using qPCR with the ΔΔCT method from cells sorted for high GFP intensity. GAPDH was used as a control RNA, and samples were normalized to eGFP samples. (G) Cells were cotransfected with eGFP or eGFP-ARS2 and gated for high GFP intensity, and histone H3 levels were measured using flow cytometry. A two-tailed unpaired t test was used to determine whether there was a significant difference between eGFP and eGFP-ARS2 in panel B (n = 5; P < 0.001), panel C (n = 5; P > 0.05), and panel E (n = 5; P < 0.001). A one-way analysis of variance (ANOVA) (F[4, 20] = 56.79; P < 0.001) followed by Tukey's multiple-comparison post hoc test was used to determine whether there were significant differences between groups in panel D. ***, P < 0.001. n.s., not significant. Error bars represent SD.

