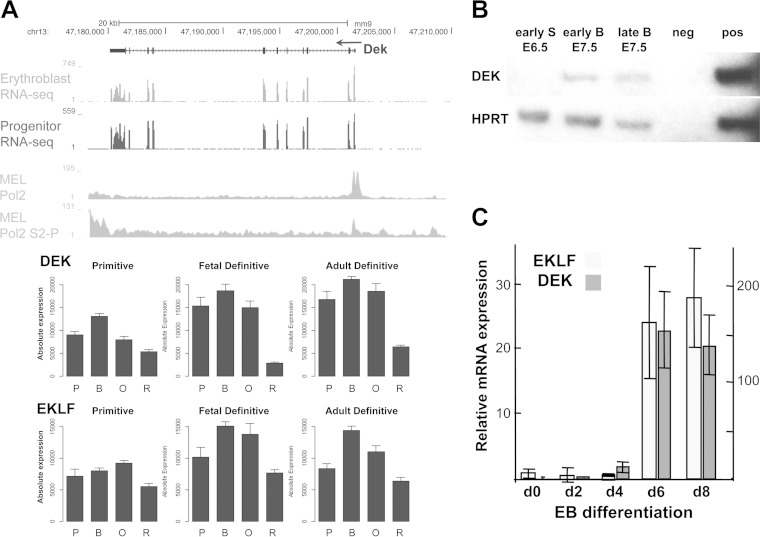
FIG 3.
Erythroid and developmental expression of DEK. (A) (Top) DEK RNA expression in mouse erythroid progenitors and erythroblasts and RNA polymerase II density (total and elongation phospho-Ser2 forms) from the genome browser (50, 52). (Bottom) Data from the Erythron database (55) show expression levels of DEK during mouse primitive and definitive (fetal liver or bone marrow) differentiation. P, proerythroblasts; B, basophilic erythroblasts; O, orthochromatiphilic erythroblasts; R, reticulocytes. (B) Semiquantitative RT-PCR analysis of DEK expression was performed with RNA from staged whole embryos at E6.5 (S, streak) and early or late E7.5 (B, bud) as indicated; water was used as a negative (neg) control; 32DEpo1 RNA was used as a positive (pos) control. Results are representative of two experiments. (C) Levels of EKLF (left scale) or DEK (right scale) were measured in RNA from EBs harvested at the indicated day of differentiation using quantitative RT-PCR and normalized to glyceraldehyde-3-phosphate dehydrogenase. Values are presented relative to day 0, which is set to 1. Results are the averages of triplicates from a single experiment that is representative of two experiments.

