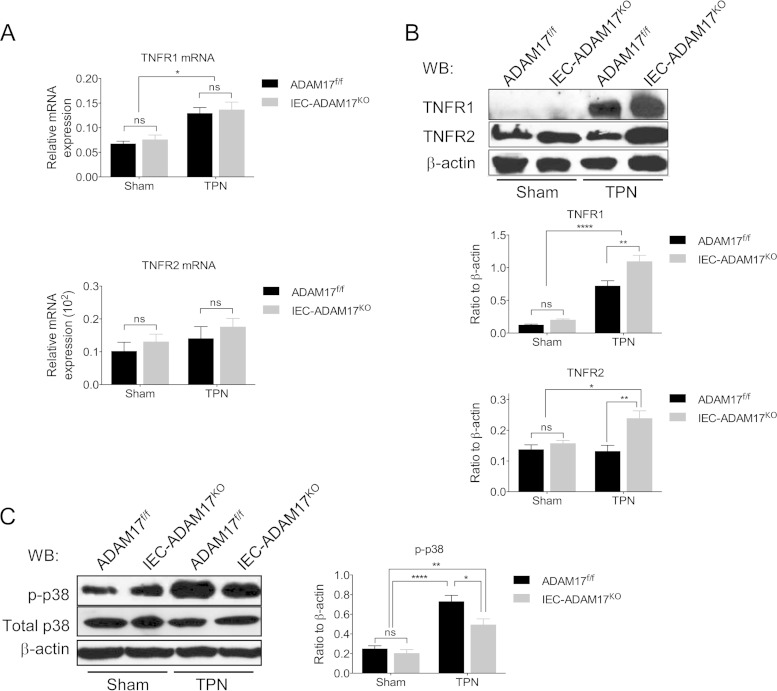
FIG 5.
TNF-α signaling is reduced in IECs from TPN-treated IEC-Adam17KO mice. (A) Real-time PCR analysis of TNFR1 and TNFR2 mRNA expression in scraped mucosa (n = 4 to 6 per group). (B, top) Western blot analysis of TNFR1 and TNFR2 in isolated IECs. (Middle and bottom) Quantification of TNFR1 and TNFR2 protein levels (n = 5 to 7 per group). (C, left) Western blot analysis of p-p38 MAPK and total p38-MAPK in isolated IECs. (Right) Quantification of p-p38 MAPK protein levels (n = 4 to 7 per group).*, P < 0.05; **, P < 0.01; ****, P < 0.0001; ns, not significant.

