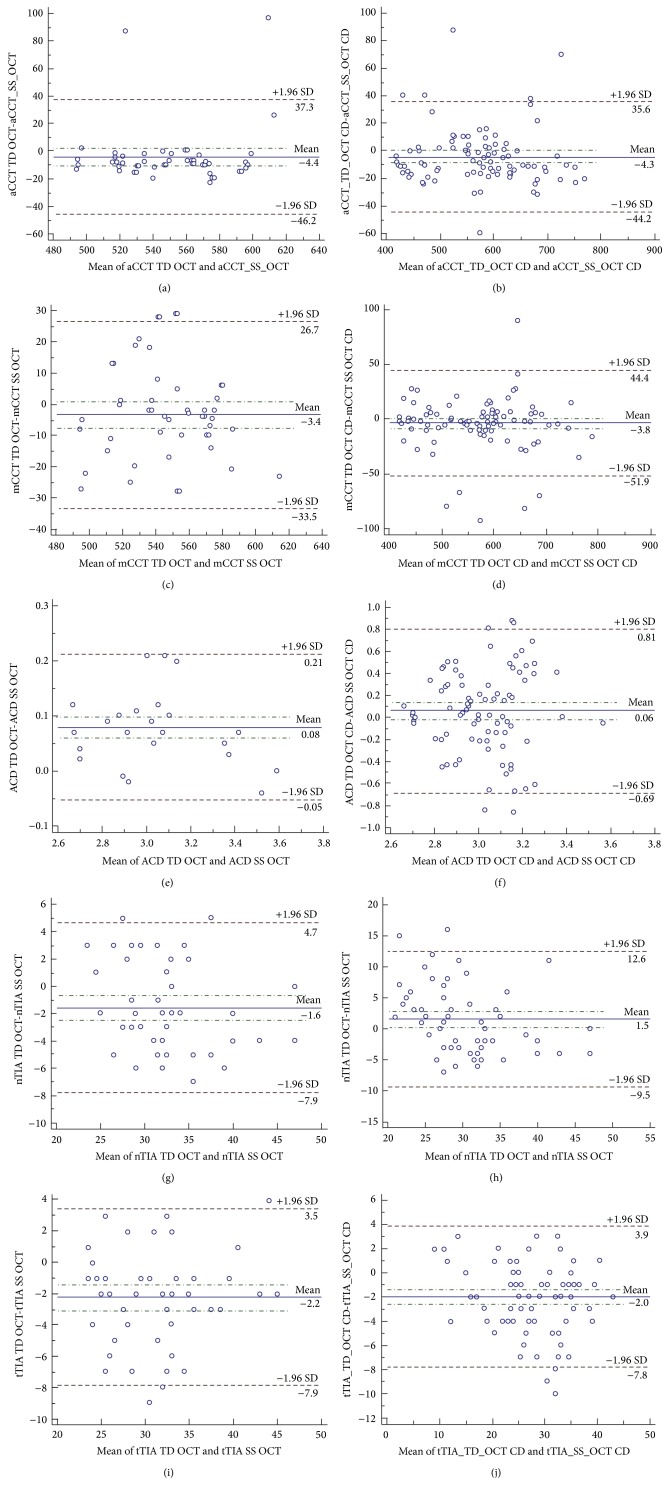
Figure 1.
The graphic presentation of Bland-Altman plot comparing measurements of TD OCT and SS OCT in control and corneal dystrophies group (CD group). Dash-dot line: 95% CI: 95% confidence interval of the mean difference; dashed line: ±1.95 SD (standard deviation); aCCT: automated central corneal thickness; mCCT: manual central corneal thickness; ACD: anterior chamber depth; nTIA: nasal trabecular iris angle; tTIA: temporal trabecular iris angle.

