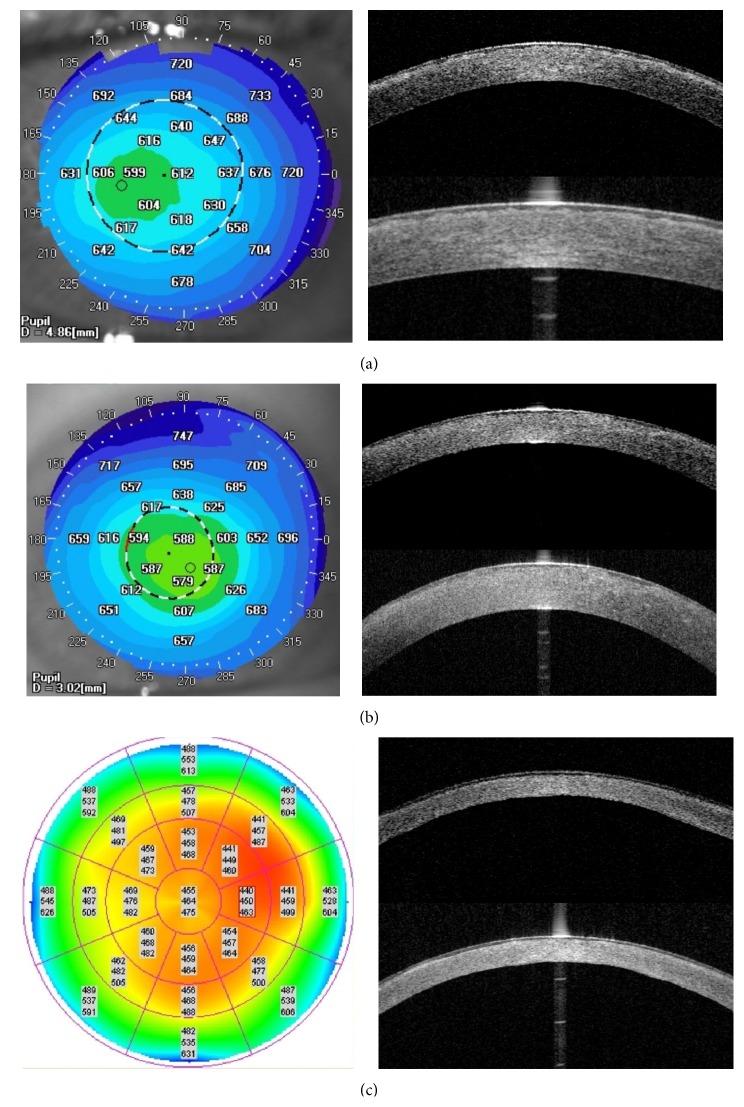
Figure 3.
Comparison of representative TD and SS OCT corneal scans in CD group. There are no differences in corneal deposits visualization between both OCT systems. (a) TBCD: SS OCT pachymetry map showing the increase of CCT. aCCT of 612 μm. TD OCT high-resolution corneal scan and SS OCT cornea scan showing increased reflectivity in the area of Bowman layer and anterior corneal stroma. The deposits are causing the irregularity of the anterior stromal border from the epithelium side. (b) LCD: SS OCT pachymetry map showing the increase of CCT. aCCT of 588 μm. TD OCT high-resolution corneal scan and SS OCT cornea scan presenting diffuse areas of increased reflectivity in the area of Bowman layer and anterior to mid stroma. (c) MCD: TD OCT pachymetry map indicating corneal thinning with aCCT of 464 μm. TD OCT high-resolution corneal scan and SS OCT cornea scan showing general increased reflectivity throughout the corneal stroma. Note the irregularity of the anterior stromal border from the epithelium side and the diffuse areas of hyperreflectivity in Bowman's layer. There is a noticeable flat layer of increased reflectivity in the posterior, peripheral corneal part.

