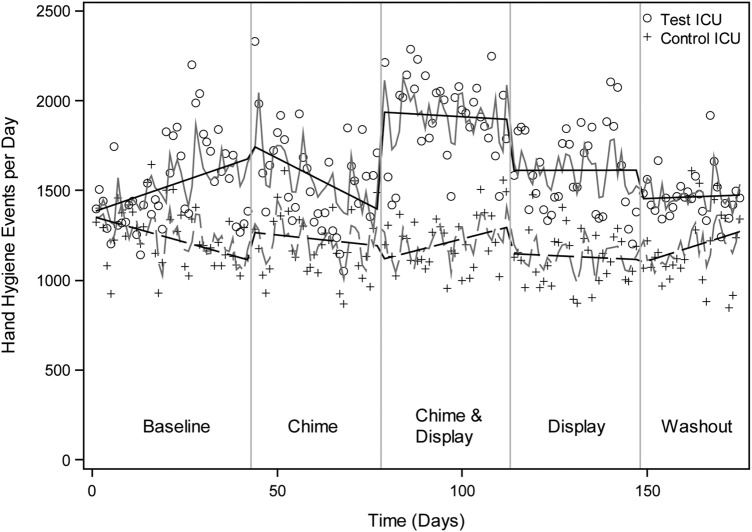
Figure 2.
Interrupted time series analysis of the daily number of hand hygiene events in the test intensive care unit (ICU) compared with the control ICU during baseline, chime, chime/display, display, and washout trial phases. o, the number of hand hygiene events on individual days in the test ICU; +, the number of hand hygiene events on individual days in the control ICU.

