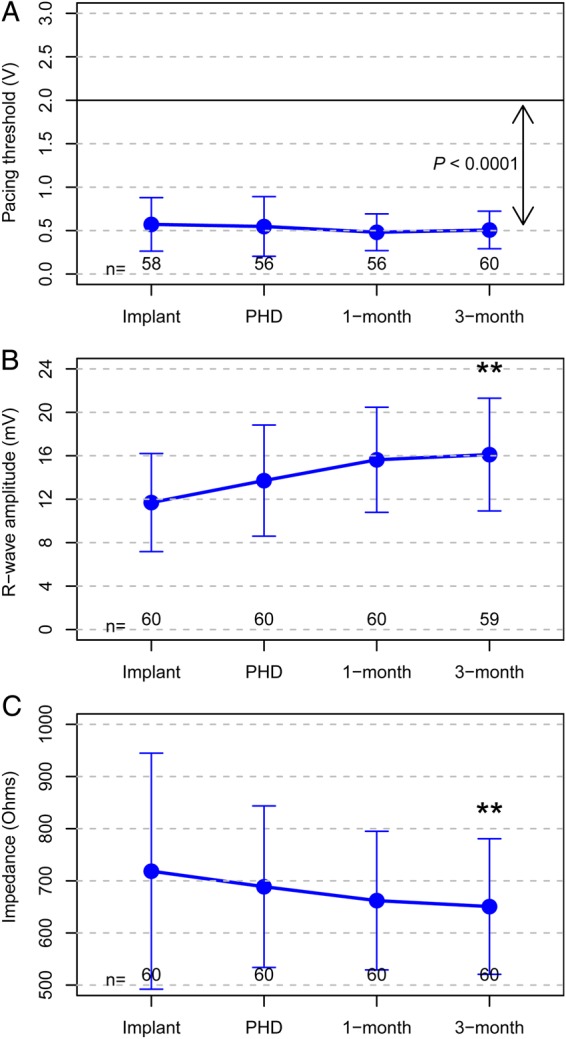
Figure 6.

Device electrical measures of first 60 patients. A, B, and C display the mean ± SD of the pacing threshold at 0.24 ms, R-wave amplitude, and impedance respectively for all data available from the 60 patients followed to 3 months. The P-value in A is for the comparison of the mean pacing capture threshold to the performance goal of 2.0V. **Significantly different from implant value.
