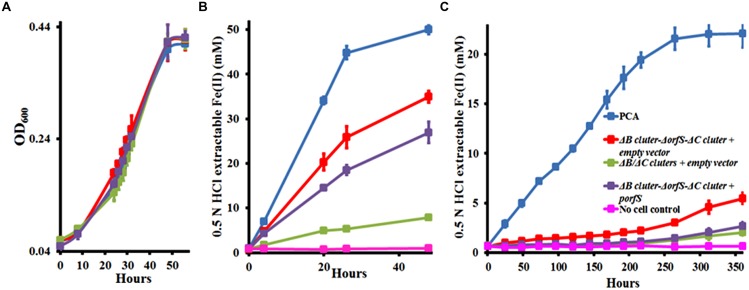
FIGURE 4.
Characterization of orfS. (A) Growth on fumarate. (B) Fe(III)-citrate reduction. (C) Ferrihydrite reduction. The curves are labeled in the same way in (A–C), except that no cell control is omitted in (A). The values plotted at each time point are the average OD600 (A) and 0.5 N HCl extractable Fe(II) (B,C) measured for each strain from triplicate assays, respectively, and error bars are standard deviations. For points without error bar, the error was smaller than the symbol.

