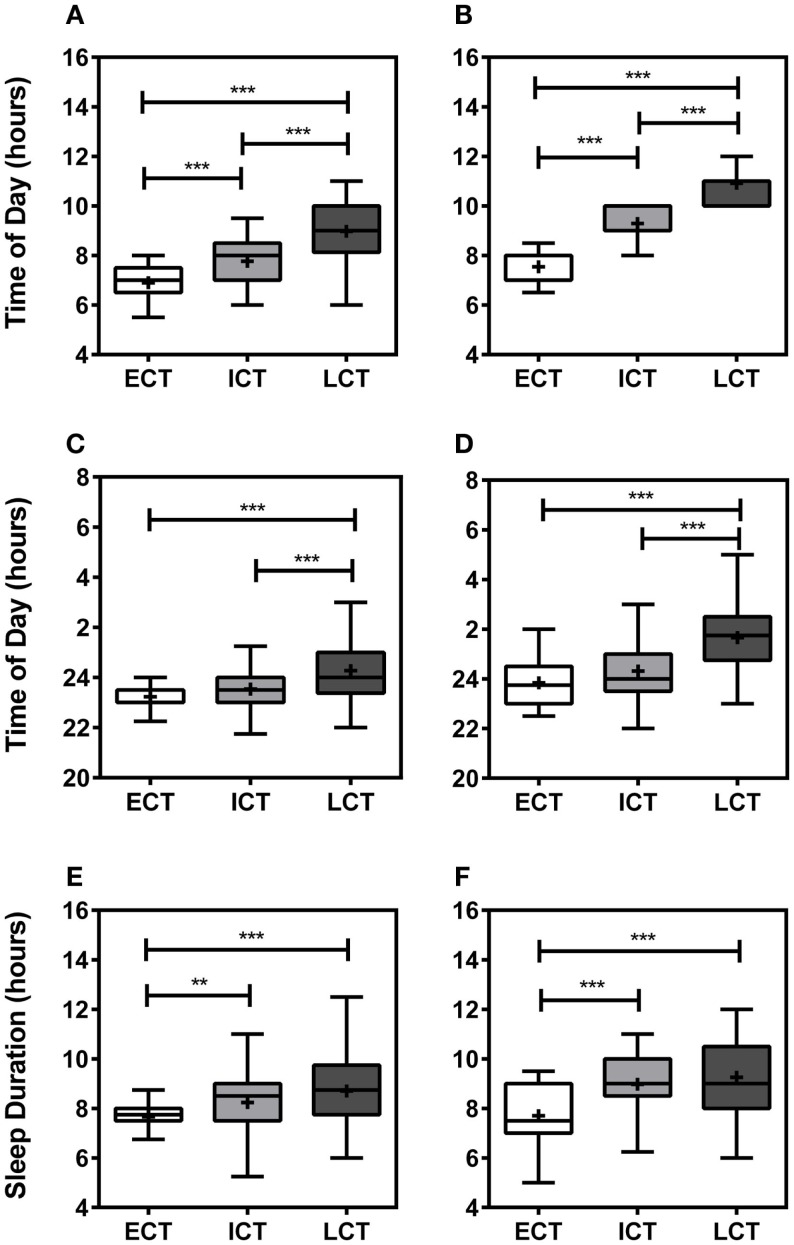
Figure 1.
Relevant sleep/wake parameters validate circadian phenotyping. (A) Average wake-up time on weekdays. (B) Average wake-up time at weekends. (C) Average sleep onset on weekdays. (D) Average sleep onset at weekends. (E) Average sleep duration during weekdays. (F) Average sleep duration weekends. White boxes represent early circadian phenotypes (ECT), light gray boxes represent intermediate circadian phenotypes (ICT), late circadian phenotypes are shown in dark gray (LCT). Boxplots show 25th–75th percentile. Whiskers and outliers are plotted by the Tukey method and the mean is shown within the box as a +. Statistical analysis was carried out using Kruskal–Wallis non-parametric tests combined with Dunn’s multiple comparison test. ns, not significant, **p < 0.01, ***p < 0.001.

