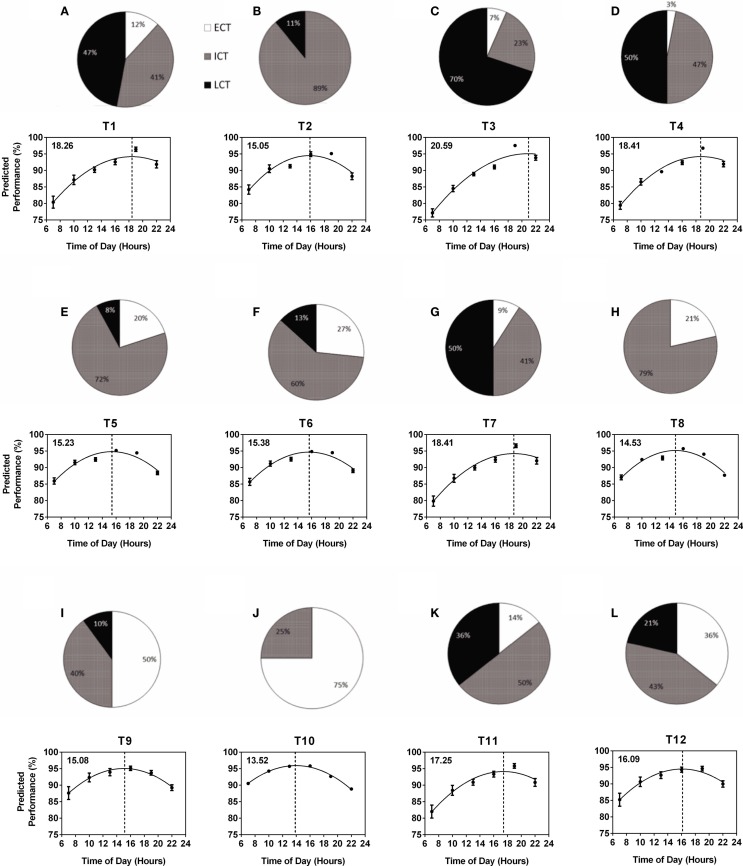
Figure 2.
Variability of within-team circadian phenotype composition determines predicted diurnal performance curves and peak performance times. Each team (T1–T12) is represented by a pie chart showing the composition of circadian phenotypes and a graph showing predicted performance over the course of a day calculated from performance tests conducted at six different times of day (25). Peak performance times are indicated by the dotted vertical lines and shown in the top left hand corner of each graph. Early circadian phenotypes (ECT) are shown in white, intermediate circadian phenotypes (ICT) in gray and late circadian phenotypes (LCT) in black. (A) T1. (B) T2. (C) T3. (D) T4. (E) T5. (F) T6. (G) T7. (H) T8. (I) T9. (J) T10. (K) T11. (L) T12.

