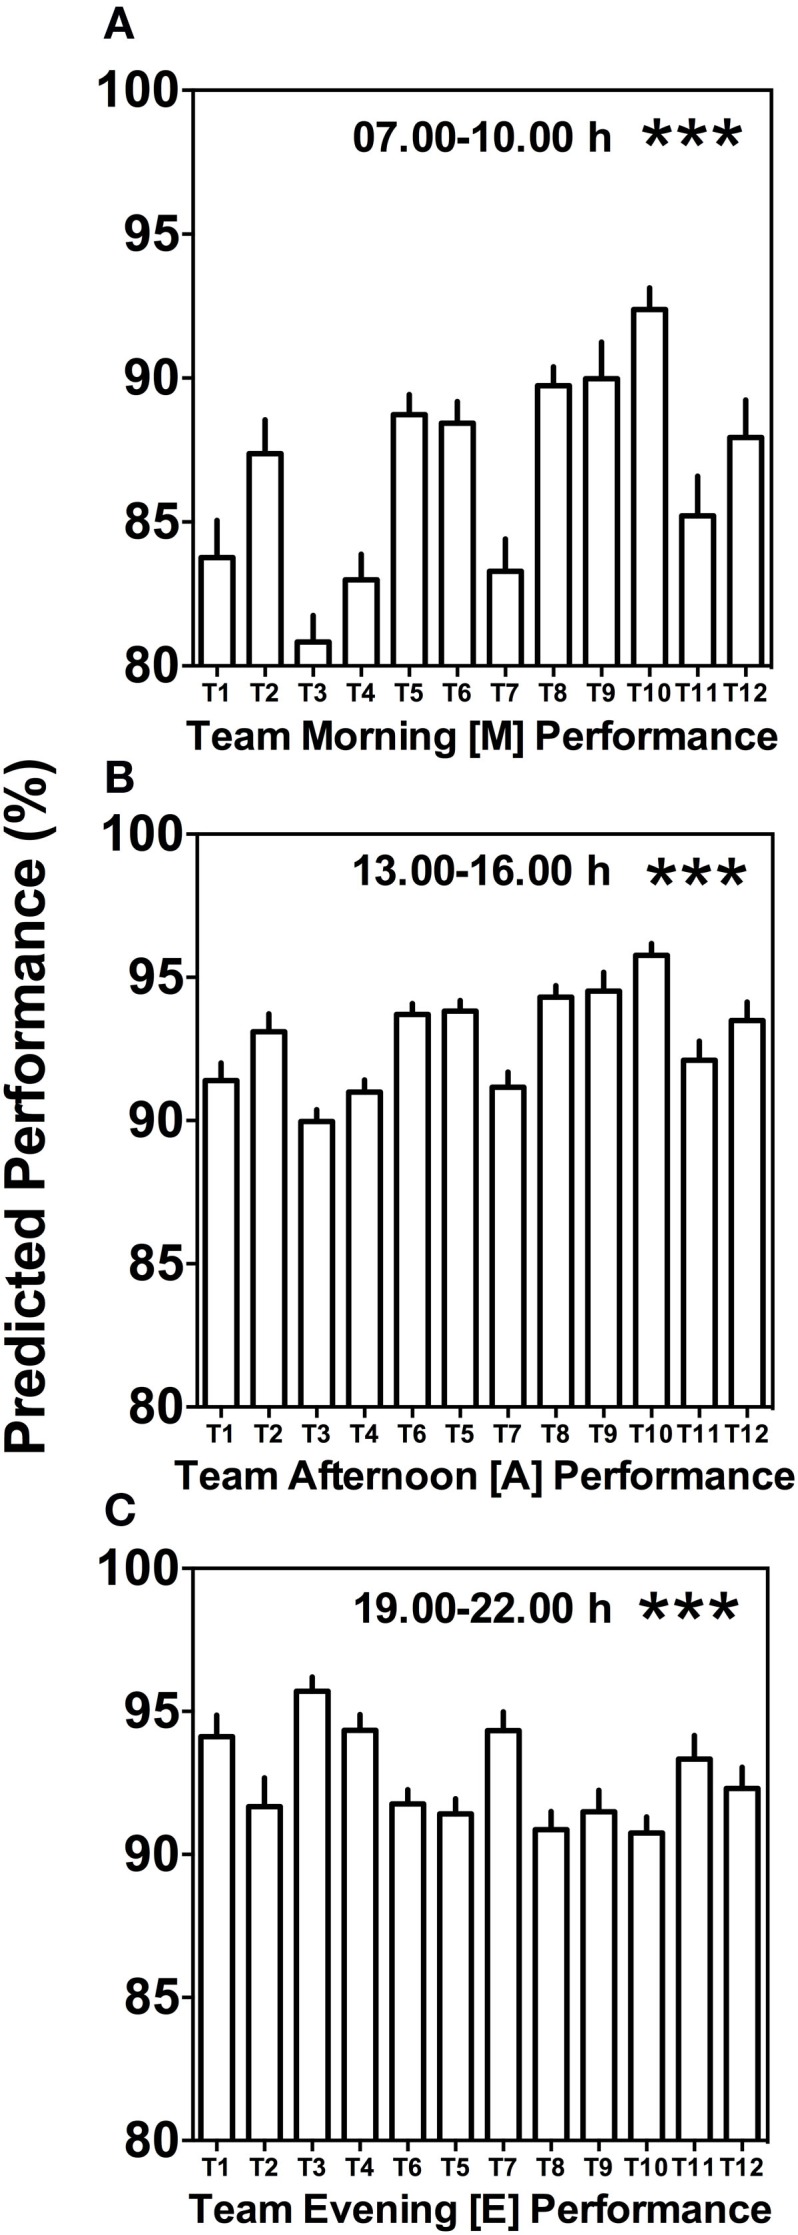
Figure 4.

Between-team performance differences are most pronounced in the morning and afternoon. (A) Average predicted team performance in the morning ([M] = 07.00 and 10.00 h performance tests), (B) average predicted team performance in the afternoon ([A] = 13.00 and 16.00 h performance tests), and (C) average predicted team performance in the evening ([E] = 19.00 and 22.00 h performance tests). Bars represent mean values + SE of predicted team performance levels based on the composition of circadian phenotypes within each team. Statistical analysis was carried out using Kruskal–Wallis non-parametric tests combined with Dunn’s multiple comparison test. ***p < 0.001. Predicted performance represents percentage of maximum performance attained. Dunn’s multiple comparison test results are shown in Table S1 in Supplementary Material.
