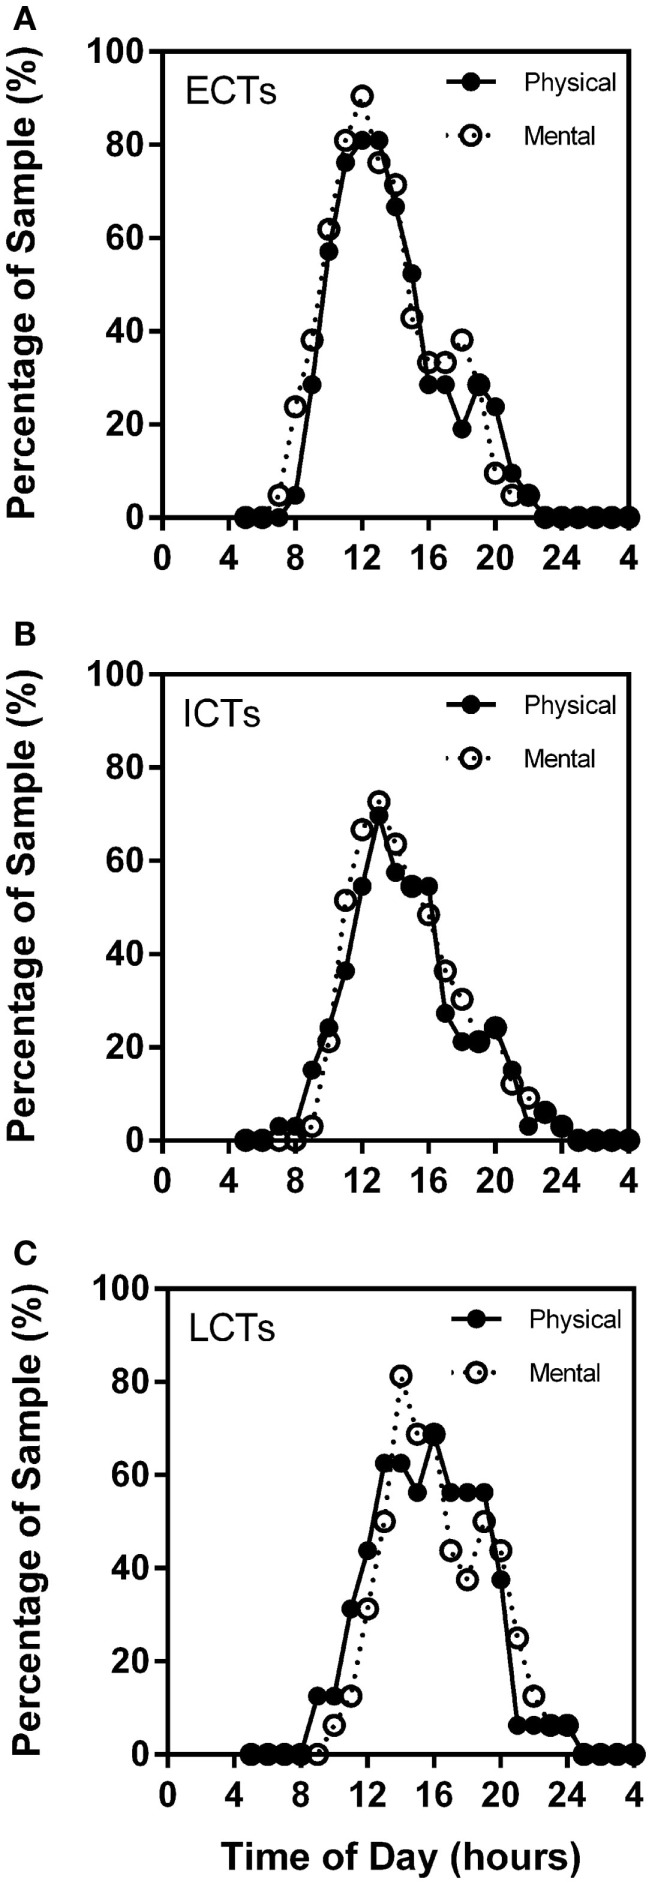
Figure 6.
Subjective mental and physical performance are strongly linked. Frequency plots show both self-reported high mental and physical performance depending on time of day. Subjective physical performance is shown by the solid black line and subjective mental performance by the stippled line. X-axes = time of day in hours. Y-axes = percentage of total sample (%). (A) ECTs. (B) ICTs. (C) LCTs.

