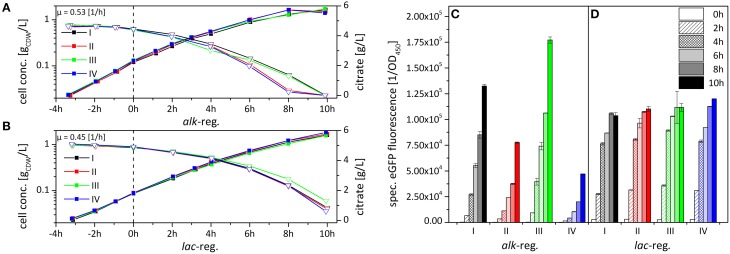
Figure 4.
Comparison of growth behavior (A,B) and variability in StyA-eGFP levels (C,D) upon expression under the control of the alk- (A,C) and the lac- (B,D) regulatory systems in P. putida DOT-T1E. Results for 4 representative cultures are shown each for P. putida DOT-T1E (pA-EGFP_B) and P. putida DOT-T1E (pA-EGFP_B_lac) (see text for details on clone selection). Cells were cultivated in M9* medium supplement with 0.5% (w/v) citrate. Induction was initiated at 0 h by the addition of 0.025% (v/v) DCPK or 1 mM IPTG for the alk- or the lac-based expression, respectively. The specific fluorescence was determined via eGFP fluorescence measurement and normalization to the cell concentration. Error bars give the standard deviations of two independent fluorescence measurements.

